Tableau Padawan - Green Pills vs. Blue Pills: The Highlight Table Edition
/We can build a highlight table in Tableau in four clicks:
- Click on a dimension.
- Ctrl+click (Cmd+click on Mac) as second discrete dimension.
- Ctrl/Cmd+click a measure.
- Click on the Highlight table option in Show Me.
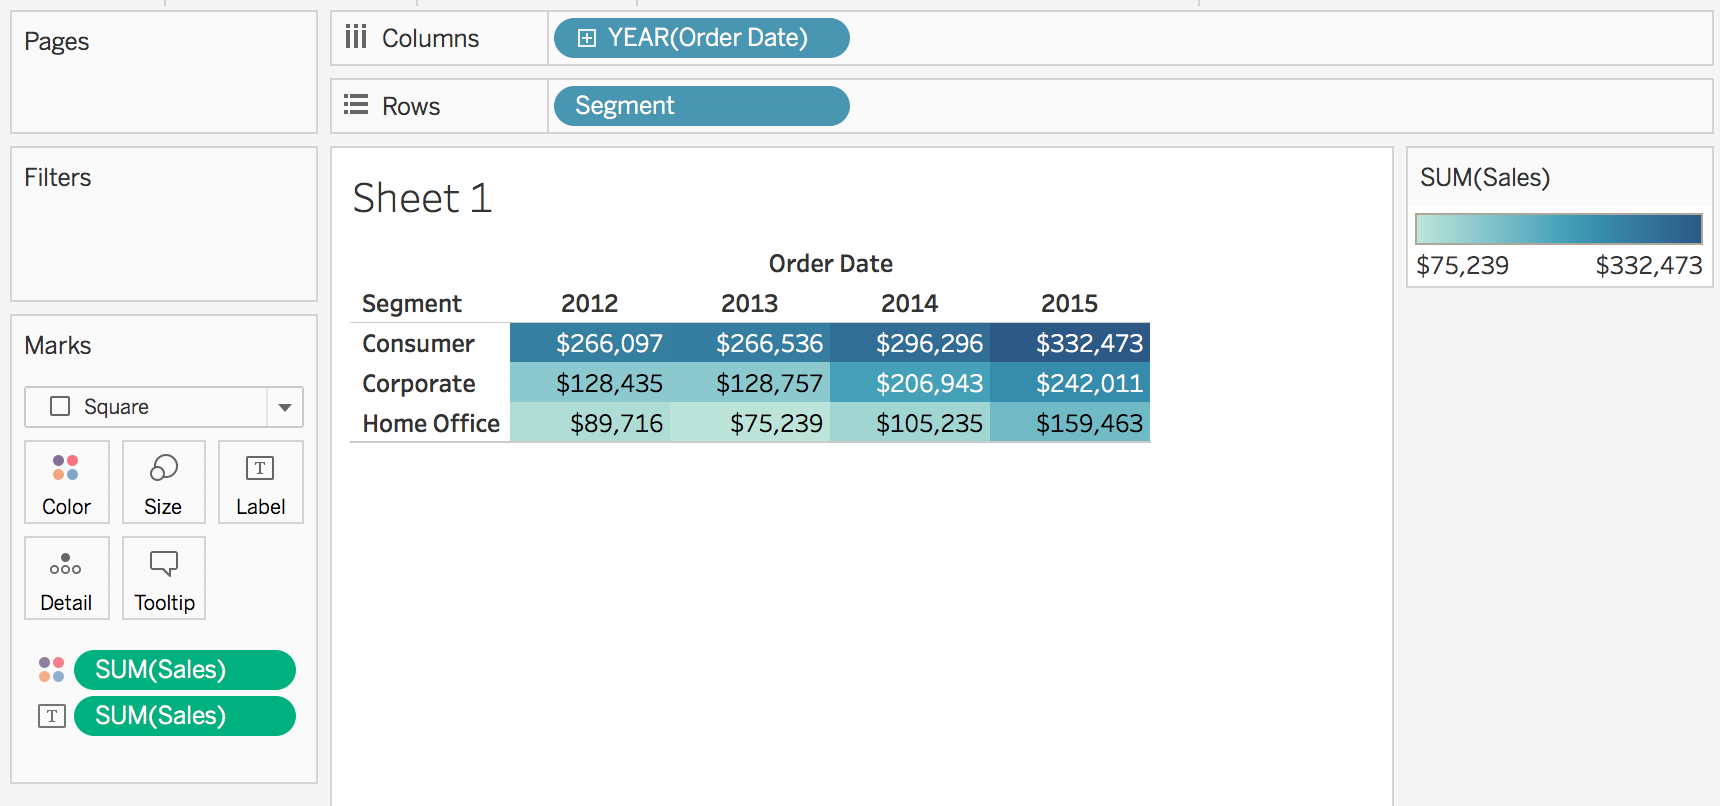
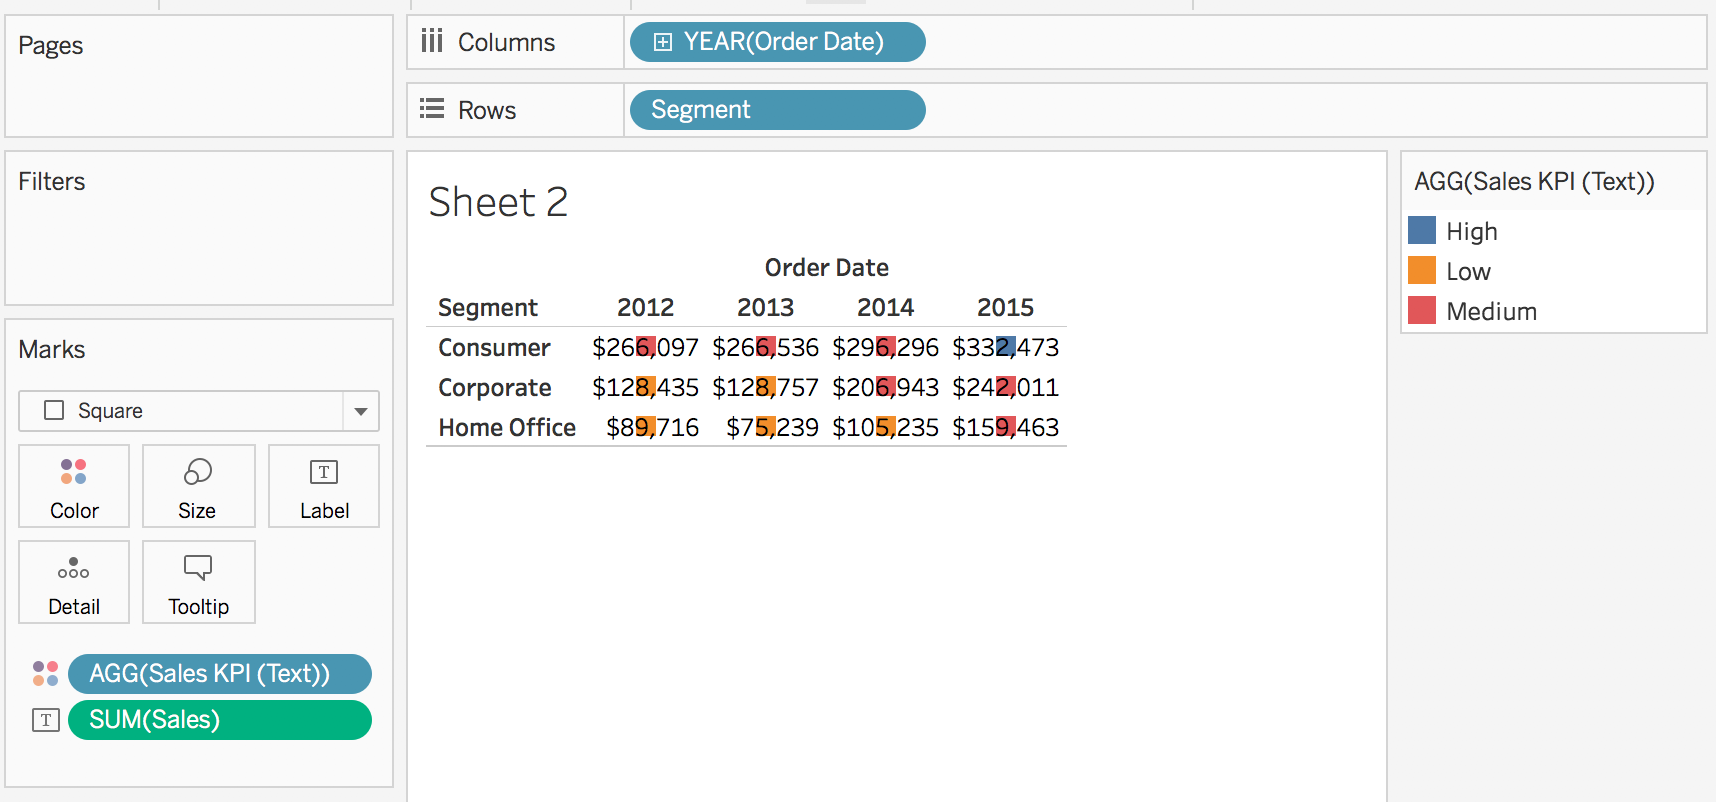
This is coloring the cells based on the SUM(Sales) measure. If we want to conditionally color them based on a Key Performance Indicator calculation like a high/medium/low such as this formula:
IF SUM([Sales]) > 300000 THEN
'High'
ELSEIF SUM([Sales]) > 150000 THEN
'Medium'
ELSEIF SUM([Sales]) >= 0 THEN
'Low'
ELSE
'Missing'
END
However, if I drag and drop Sales KPI on top of the existing SUM(Sales) pill on Color then I get some squares:
If I just click on the Size shelf and slide the Size slider to the right then I end up with giant squares that overlap other cells.

This looks to be very strange. In both views I’m seeing Square marks and yet the original Highlight Table has the cells perfectly filled with each value and the one using the KPI doesn’t. What’s up here?
Green vs. Blue - Color Matters
The distinction between the views is that the first highlight table is using a green (continuous) pill on Color and the second table is using a blue (discrete) pill on Color. Here’s an example to show that truly is the difference between the views. This KPI calculation that has the same algorithm as before, only this time it’s returning numbers instead of text, so it defaults to being green (continuous):
IF SUM([Sales]) > 300000 THEN
3 //High
ELSEIF SUM([Sales]) > 150000 THEN
2 //Medium
ELSEIF SUM([Sales]) >= 0 THEN
1 //Low
ELSE
-1 //Missing (Null)
END
When I put this onto Color using the default green pill I get the desired highlight table:

However as soon as I make the calculation discrete I get little colored squares again:

In our Tableau trainings something I try to drill into my students is that the pill layout (the type of pill and what shelf it’s on in the viz) is the visual specification. In this case we’re seeing two different results in a viz and that’s because the pill layouts are different. In one viz we have a continuous measure on Color and in the other a discrete measure on Color, and that distinction is what is responsible for the different views. Tableau’s internal logic for this gives us both a different color palette (sequential for continuous and categorical for discrete) and given this pill layout lays out the marks differently (fully-filled cells using Square marks for the continuous and small Squares for the discrete).
Now sometimes we can get away with using a sequential palette to simulate a categorical color palette, in simple situations we might be able to use the Stepped Colors option and in more complicated situations use a custom color palette as described in [Color the Dupes](http://redheadedstepdata.io/color-the-dupes/) by Keith Helfrich. The challenge with using those methods is that we don’t get a color legend with labels for each color. Therefore, I offer these instructions below.
Creating a Highlight Table Using a Discrete Pill on Color
There are at least a couple of methods for creating a highlight table using a discrete pill on Color, here’s the fastest that I know of:
1. Select your dimensions and measure you want to use for the label, then use Show Me to build a highlight table. You’ll end up with a view like the first screenshot above.
2. Click+drag the discrete pill you want to use for coloring the cells and replace the existing pill on Color. Tableau will draw a view with squares.

3. Change your mark type to Gantt Bar. Tableau will draw small Gantt Bar marks in each cell.

4. Right-click+drag (Alt+click+drag on Mac) Number of Records onto Size. Tableau will display the Drop Field window.
5. Choose MIN(Number of Records) and click OK. Tableau now draws bars that fill each cell horizontally but not vertically.

6. Click on the Size shelf and slide the size slider all the way to the right. This changes the width of the Gantt bars so they now fill each cell.

7. Do any final formatting to set colors, column widths, remove the Size legend, etc.
Conclusion
That’s how to get the highlight table you want no matter what kind of pill you have on the Color Shelf! Here's a link to the Tableau Public workbook.
If you want more tips and instructions like this sign up for our @helpmedatablickTableau tip of the day or even talk with us about a Tableau training!
