3D "Printing" in Mapbox, Alteryx, and Tableau: "I've got big balls!"
/While starting to work on a new viz project, I came up with the idea to create empathy by putting the user inside of a 3D map with the data happening around them like a virtual reality movie. Yes, the DataBlick crazy-town express train is starting to chug out of the station again.
The viz involves bombs and so I wanted to be able to create an artistic effect beyond just the standard circle on a map where the bomb dropped. Mapbox has a wonderful Extrude Feature where you can pick a Base Height, Height (of Extrusion), and stylistic choices, such as color and opacity. Below is an example of using Extrusion by Sarah Michael Levine who used Mapbox GL's extrude property to create a Jersey City Building Census complete with 3d buildings.

I wanted to use this feature to get a bit more stylistic and create the bomb blast radius to have a futuristic UI look. Something more like the shot below from the Hunger Games control room.

Okay. I am a long way from that, but here are my initial rough sketches. My first experiment was in using extrusions of different radii, extrusion base and heights, and opacity. To create the shapes, I brought some latitude and longitude points into Alteryx, and used the Trade Area tool to create circles around the points of different radii. To create the points around the extrusion, I then took one of the trade area circles, and used the Poly Split tool, which broke up the circle into 100 points. These are now styled below to show numbers for selected points, but I am working on turning this into a compass thanks to a suggestion by Allan Walker.
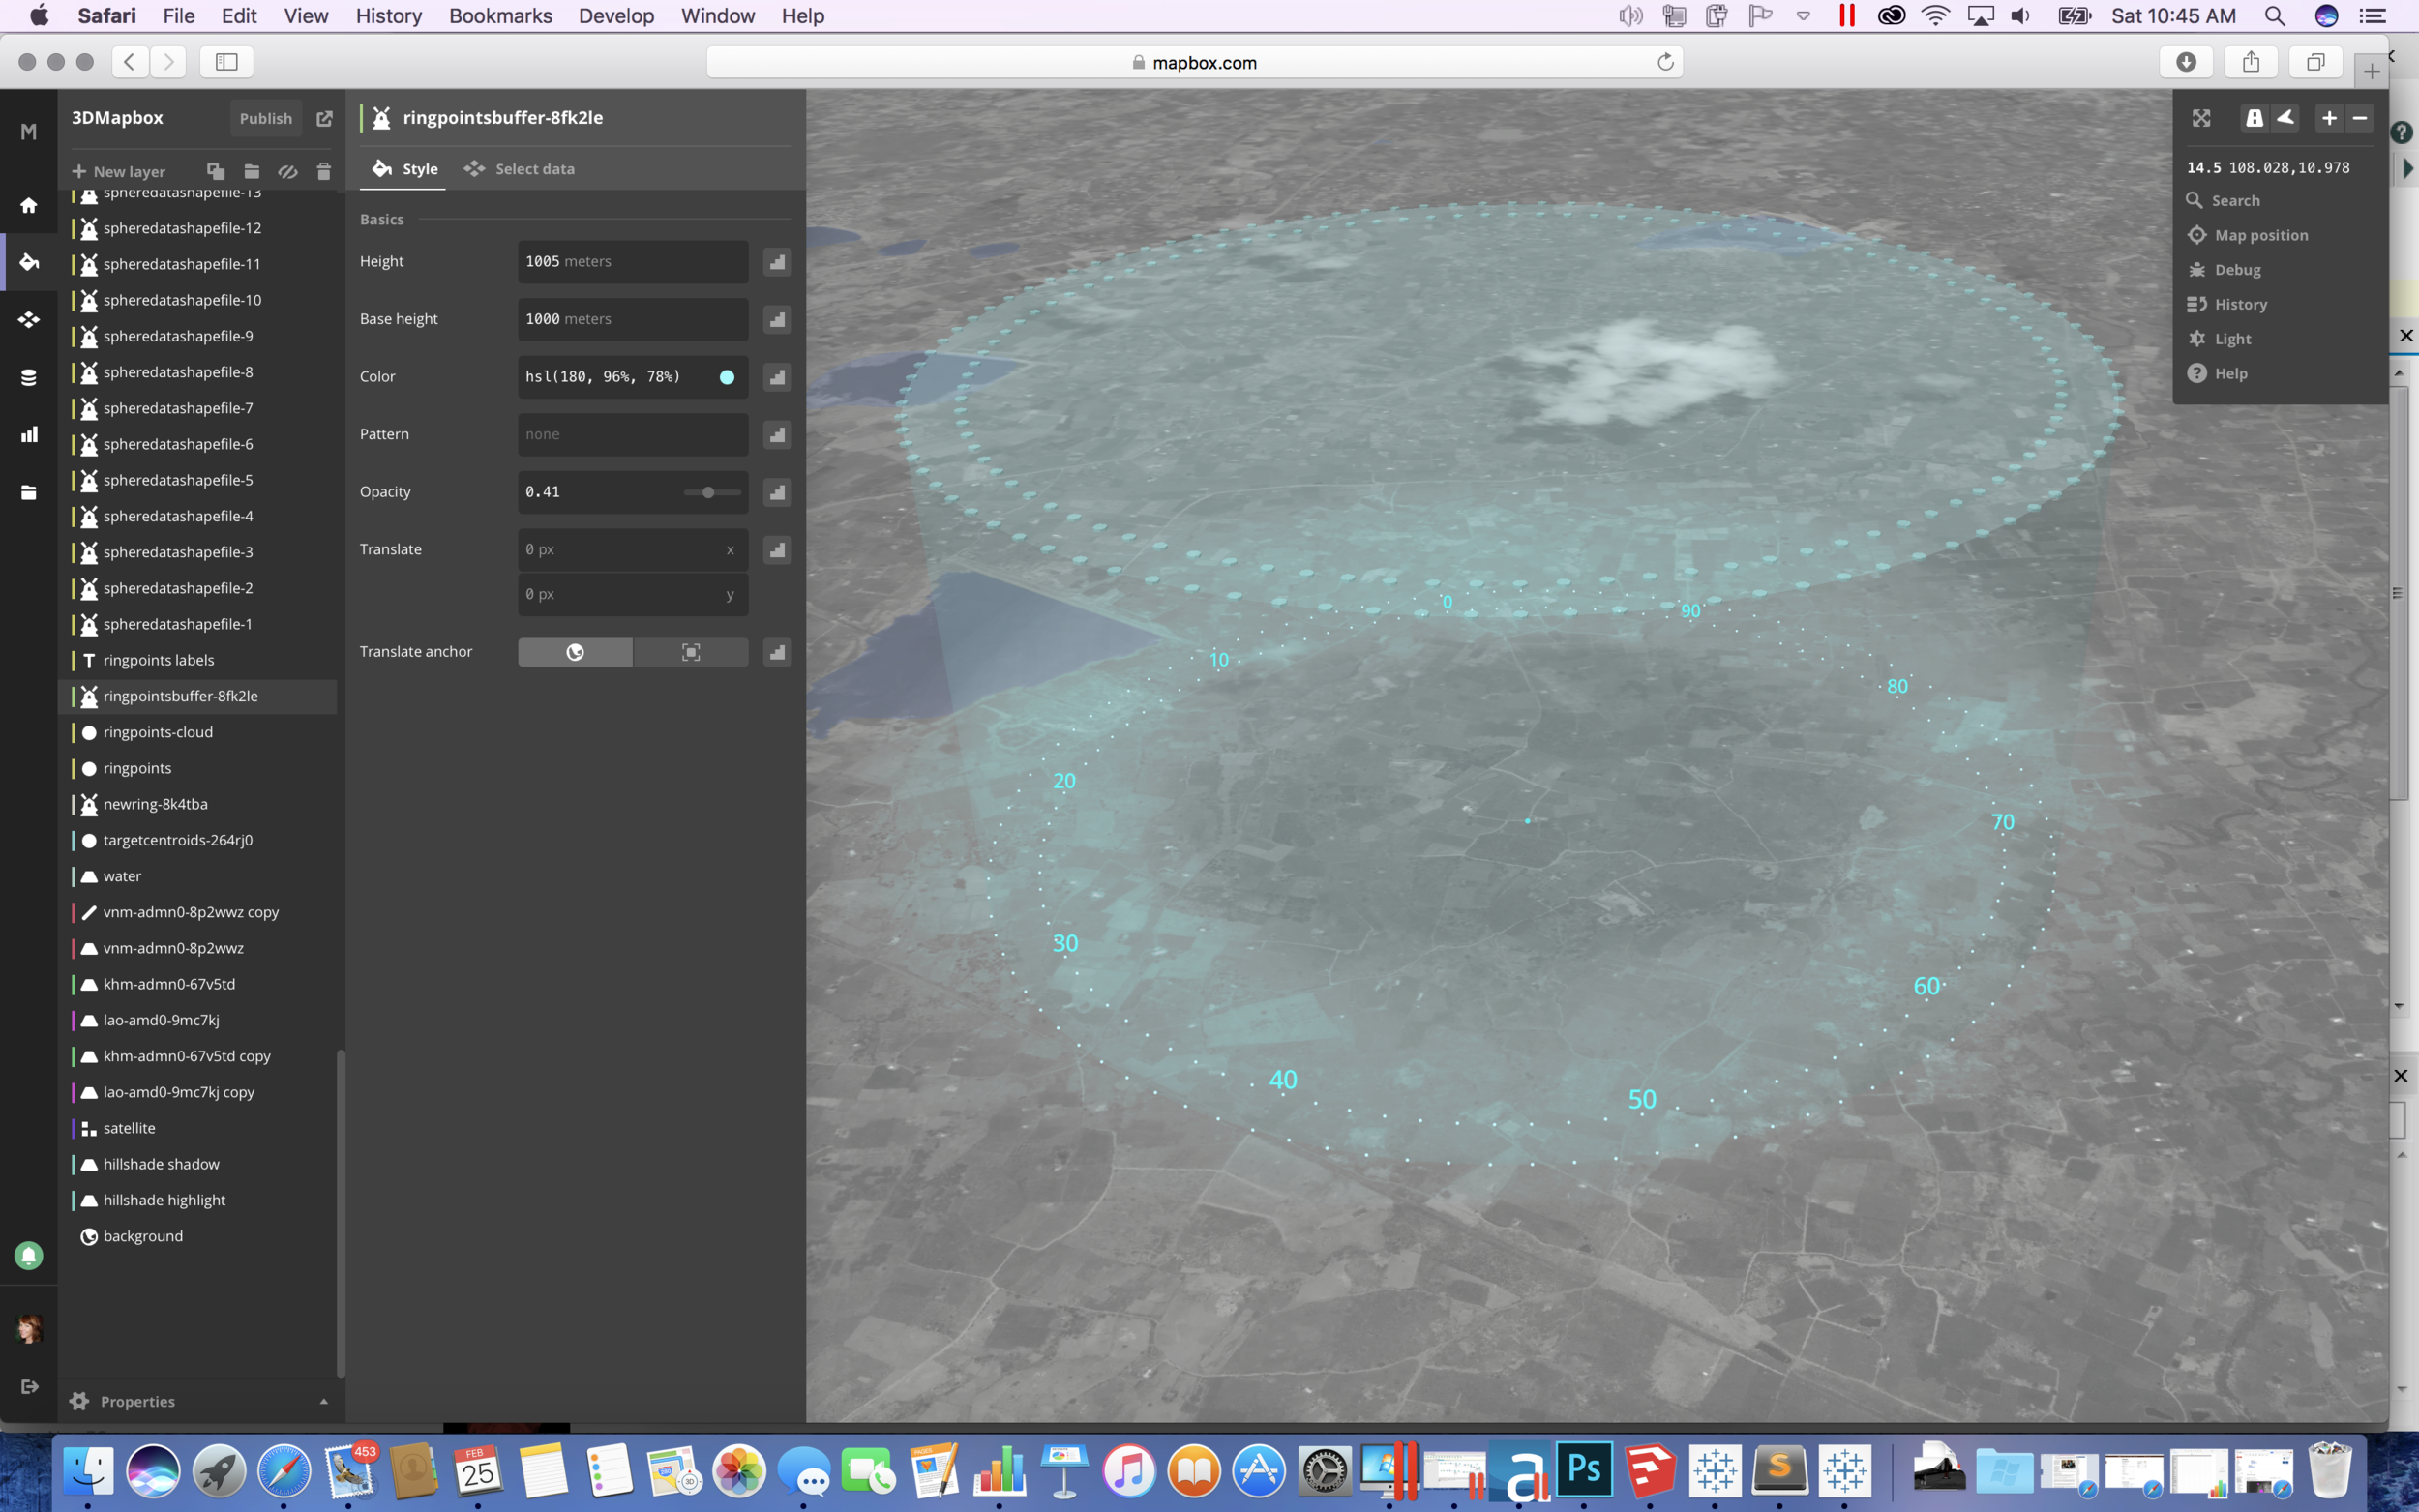
I then exported the all the shapes using Alteryx to Shapefiles. In Mapbox, I uploaded the new "wo-man-made" shapes and began to style them. The below consist several shapes, including the points created by the Poly Split tool as points with labels around the base, extrusions of two circles with different radii to create the cylinder, and a shape version of the Poly Split points extruded at a base height of 1000 Meters with a heigh of 5 Meters as show below. The cloud at the base was simply another copy of the Poly Split points with a large blur transparency applied.
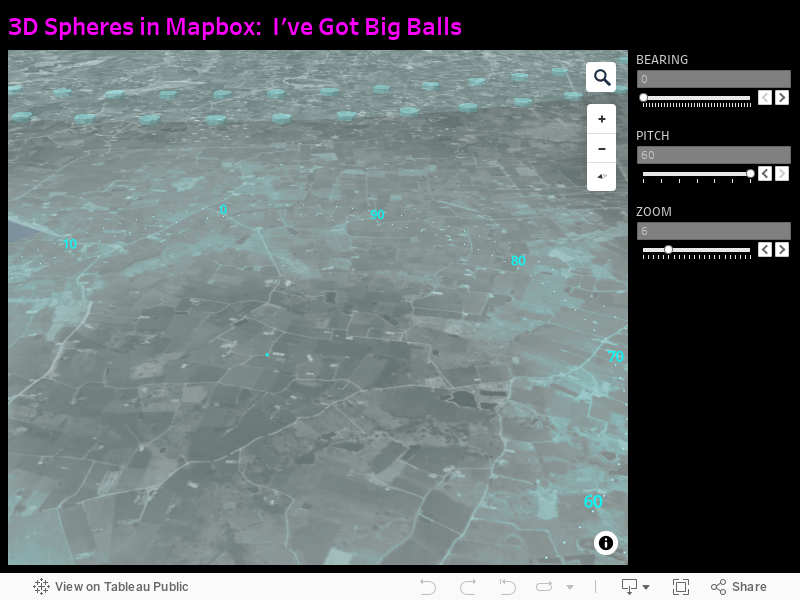
I was pretty pleased at this point, but wanted to explore moving beyond just extending Z straight up and down. I wanted big balls! If you have been reading my other blog posts lately, you know I have been on a 3D kick lately. If you haven't then please check out X, Y and a bit of Z - Cheater 3D Orthographic Views & Making everything "Spatial" and The 3D Tableau Full Monty. I began to think about how to create the curves in Mapbox needed to create a sphere. I thought about how a 3D printer would create curves and decided to "slice" the sphere into 100 sections and style each with an increasing base height and different radii. First I needed to slice the sphere and calculate the radius at each slice.

I made a few attempts in Alteryx and got fairly close. Starting with the centroid of San Francisco and Los Angeles as simple text inputs, I created 100 rows of data for each centroid with an Index field to be used to calculate the radii as the slices moved away from the center of the sphere. The goal would then be to "blob" out the 100 circles using the Trade Area tool and the radii field. I got fairly close, but I finally had to call in a DataBlick, big gun. Noah Salvaterra to the rescue!

We now had 100 flat circles for each city, and exported those all as Shapefiles. Now the crazy part, how to get that to look like a sphere in Mapbox Studio, as I wanted to bring this into a Tableau workbook.

I imported the Shapefile into Mapbox and copied the layer 100 times, filtering each on its layer ID and incrementing the extrusion base and height 500 meters for each. In the above layer 86 is styled differently to show an individual slice. Yes, this took a bottle of wine and most of Friday night and next time I will take a more programatic approach and pre calculate these in Alteryx as columns and use the Mapbox GL JS instead.
Now to have fun with it in Tableau. Remember at the beginning, I said I wanted for the user to be inside the viz. When we bring Mapbox into Tableau it is always looking at the map from a Pitch of 0. I emailed Ryan Baumann of Mapbox, to ask how to add bearing and pitch:
"Absolutely. The last parameters in the hash are for bearing and pitch:
#{zoom}/{lat}/{long}/{bearing}/{pitch} "
Sweet, so now I could bring in my Map pre-tilted!
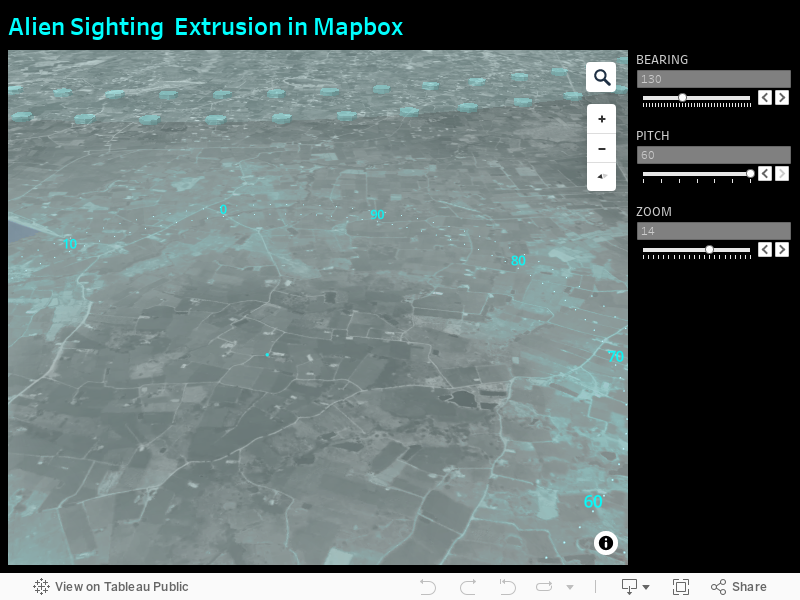
Allan then Parameterized the URL link so that, in addition to the user being able to control the map zoom, pitch, bearing, etc. with the mouse, they could also type these things in via Parameters in Tableau. I will let him show you why he wanted to pass parameter values to control this (hint, my movie idea and JS API...).
I'm now hunting around on Sketchup looking for fun models to 3D slice up and extrude. What will you add now that you have a 3D universe?
