"Off the Grid" - building Lo-Fi dashboards to create use and value
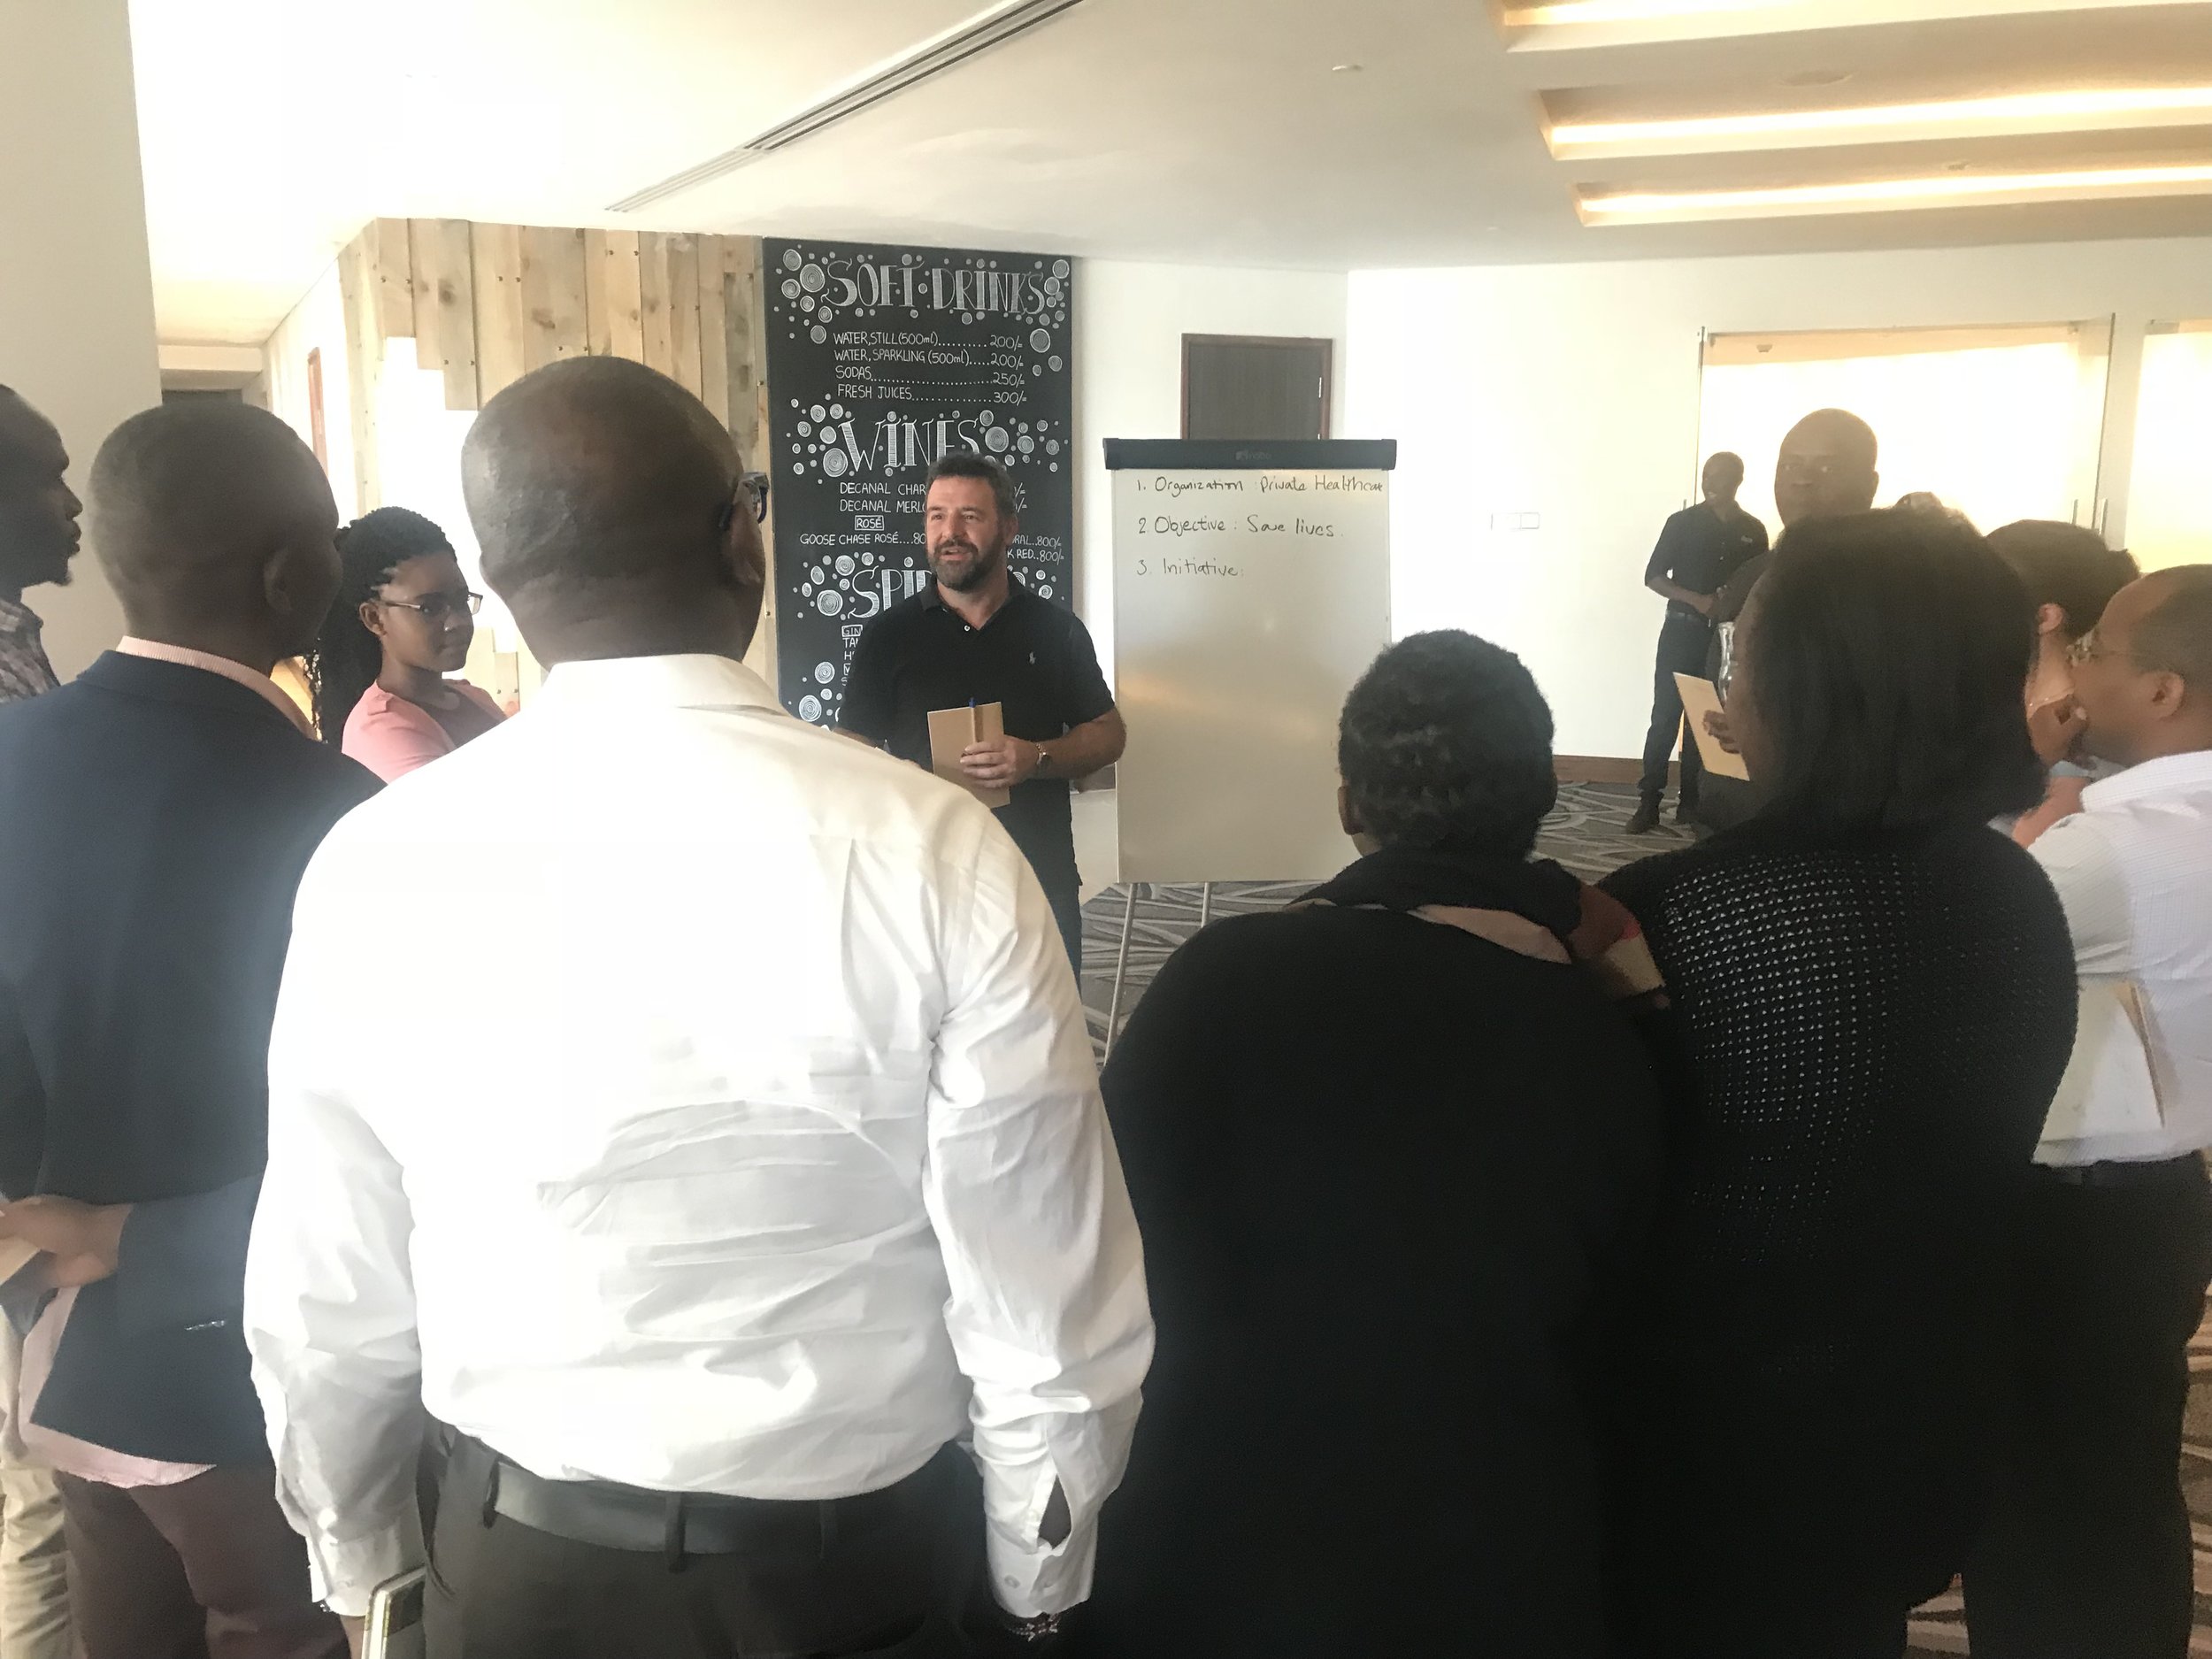
/I recently had the opportunity to help organize and present at the first Tableau “Kenya Day for Data”. In addition to great talks from powerhouse organizations like the World Food Programme (WFP), World Health Organizations (WHO), and PATH, I ran a hands-on workshop on “How to Build Dashboards of Use and Value”. What was unusual about the workshop is that it took place entirely using flip boards, stickies, and markers, instead of Tableau. Without a pixel being pushed by the participants, they were able to walk away ready to build effective and powerful data tools.
This activity works well because:
participants from diverse organizations or departments allow additional perspective
design constraints such as data availability, technical complexity, and office politics are removed
great way to get people to think about what they're really trying to solve for
encourages people to not always work in isolation
allows for optimal creativity - the sky’s the limit!
Many participant said it was one of the most valuable workshops they had every attended:
“Hands down the most productive hour I have ever spent with the Tableau community.” — Allan Walker
“One of the best received parts of the day was the workshop on building dashboards of use and value, which was run by Anya A’Hearn of Datablick. The workshop took people out of their “build the dashboard someone asked for” comfort zone and pushed them to think about how to answer a specific business question instead. The results were awesome and even included story-points, filtering, and tool tips, all pieced together using post-its and flip-boards!” —Amanda Boyle
Here is the nitty gritty so you can hold a similar workshop at your local TUG, or office.
You will need a facilitator for each group. Thank you’s to my facilitators, Allan Walker, Amanda Boyle, Jeremy Blaney, Catherine Denmeade, and Gaetan Bailby, and all the wonderful, energetic, and creative participants. You will also need supplies such as flip boards or poster paper for each group, a ton of stickies, and markers. Before the session you can present on key ideas of designing a useful dashboards such as:
Define the goal of your tool
What are the strategic objectives of your organization?
What initiatives are you engaged in that support that objective?
How is the tool you are building ensuring the success of that initiative?
Requirements gathering
What is the one business question that the dashboard is trying to answer?
Who is the end user of the dashboard (target audience)?
What is the familiarity of the end user with the subject matter?
Is there a target, or benchmark for the metrics?
How will the user flow through the analysis to arrive at an actionable insight?
Now to start the fun:
Exercise 1 (5 minutes)
Break into teams of 5 - 10 people based on a random number assignment. This helps to break up usual teams.
Pick (or assign) a single organizational objective and support initiative.
Exercise 2 (3 minutes)
You have 3 minutes to write down as many business questions as you can about supporting your selected initiative on stickies.
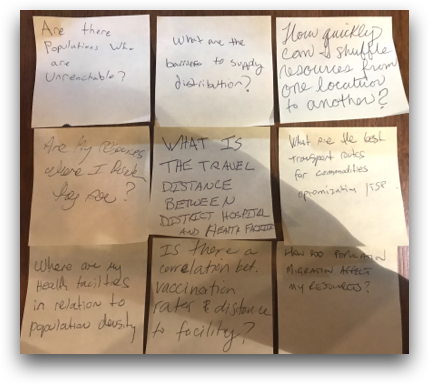
Exercise 3 (10 minutes) as a group:
Review the questions by posting them on the flip board one by one.
Out of all the stickies, pick one key business question
Pick an end user, goal, and context

Exercise 4 (5 minutes)
Every person in your group draw your ideal version of the dashboard
Reminder: Must be useful and answer the business question!
Where am I relative to where I think I should be?
If not, why? What is this attributable to?
How do I take action?

Exercise 5 (20 minutes)
Present the individual dashboards to your group
Discuss why you put each element on the dashboard
If you can’t justify it as supporting the answering of the business question, or driving action, remove it.
Agree on an ideal dashboard, and draw it on the large flip board paper. One or two people from your group will have to present it to the entire meeting walk through the logic and justification of the dashboard as well as how the user would interact with it.
Exercise 6 (20 - 30 minutes depending on the number of groups)
Present the group dashboards to everyone. They should be presented from the perspective of being used to support your selected initiative, and walk through the flow of insight to action.

If a team does not meet the goal, for example by “kitchen sink-ing” a dashboard, just have fun and point out what could have been done to optimize the efficacy of the dashboard so everyone can learn from the example.

Prizes are also welcome for outstanding solutions! The below was one of my favorite presentations. Watch and enjoy the fun of being able to create and present an ideal dashboard in under an hour!

During the exercise make sure your facilitator is mindful to let everyone have input and not allow one person to dominate the conversation. During the final presentations, remember this was a group effort. Have fun!
I hope to hear of useful events based off of this one and anything that worked or didn’t or how you improved on it. I’m planning one for the SFBATUG soon so stay tuned!
Happy dash-boarding!
Anya
