Great Arcs in Tableau by Chris DeMartini
/
This is one of many posts on the subject of Great Arcs which ultimately lead us to the re-make of the 1983 cult classic Wargames in Tableau. I encourage you to read the whole series of posts by the wider team in addition to this one.
Why Arcs? … I say Why Not?
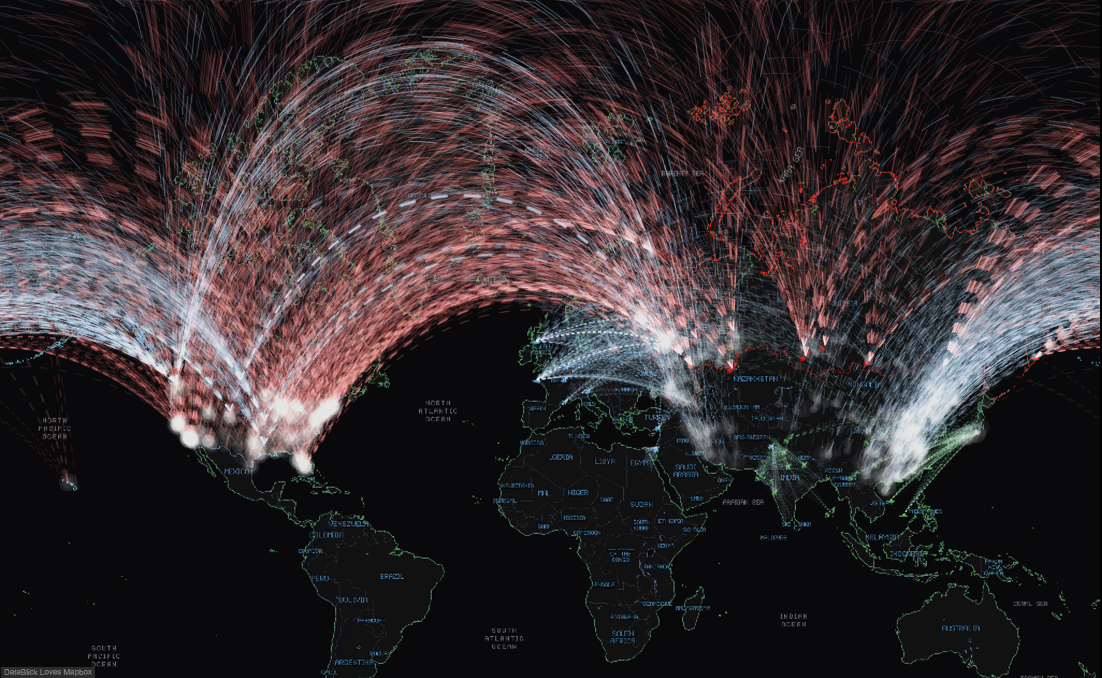
Beyond the why not and the fact that they are more aesthetically pleasing to the eye, I have found that the use of curves, arcs, etc. helps to significantly reduce over plotting when visualizing relationships between nodes (or cities). As an example, compare the below image to the header image, same data, same locations, same amazing Mapbox map created by Anya, only difference is the curves and that I got a little lazy with the colors below.

At this point if you are asking yourself what is a great arc (or great circle), please take a quick minute to go through this tutorial on the usgs.gov site. I found this walk through (embedded below) to be a very helpful explanation of the great arc concept with respect to our globe.
Now that we have answered the why, we should all say a big “thank you Alan Glennon!” Wherever and whoever you are out there, this post would have taken significantly more time to create if it wasn’t for the Python code you shared.
Here is Alan’s code posted in the linked thread…


Once I stumbled upon this, I ported the math from Python to Tableau. In the spirit of leveraging the work of others, this post is based around the concept of you “copy and pasting” from my work to incorporate great arcs into your own Tableau workbooks. Outlined below are the steps that you will need to complete in order to make your own arcs.
Step 1: Get your data ready. Since we are building a map with paths (and also using one of my favorite tricks, data densification) we need to structure our underlying data accordingly. Sadly we cannot perform calculations on Tableau’s generated latitude and longitude, thus we need to source the coordinates in our data (see the note below on this). Here is what I am going to start working from for the purpose of this post.

Here are the steps we take (assuming you are in Excel) to prep our data. If you are planning to copy and paste the formulas from my workbook, please follow my field names exactly so you don’t run into orphan fields within the calculated fields.
- Add “Path” field with unique identifier for origin/destination combination (I am lucky and already have “ID”).
- Add “Path Order” field with value of 1.
- Copy the above two fields down your entire data set.
- Copy the entire data set (including the new fields) and paste it below itself with one blank row in between.

- Update the second block of data to have path order value of 2.
- Delete the blank line between the two blocks (this is only there to keep track of where one block stops and the other starts).
- Sort the data by path and then path order. Your data should now look like this.

- All columns are duplicated except for path order. This is what Tableau likes to see!
Note: Above I assume you have latitude and longitude field values in your data. If you don’t put your data into Tableau, have Tableau generate the latitude and longitude for each location. View the data in Tableau and then copy and paste that into Excel. You can then join the Tableau generated latitude and longitude back to your original data. Congratulations you just geo-coded your data via Tableau!
Step two: Bring your data into your Tableau workbook. Download and open a copy of my Tableau Public workbook embedded in the blog below. Go ahead and make a straight line map with path for comparison later… Here is mine

Step three: Now that you have your prepped data and a copy of my workbook ready to go, all that remains is copy and paste, creating a bin and some dragging and dropping.
- Copy and paste the field “BezierValue” to your workbook.
- Right click the “BezierValue” field and select create bin (make sure bin size is 1)
- Next copy the following fields (I have them somewhat grouped in my workbook so it should be easy to do all of these at once. You may be tempted to copy all these fields with BezierValue, but trust me that it is easier to do BezierValue first, create the bin then copy and paste the rest of these. (See note below if you get errors on this step)

- Make sure the gc_newlat_degrees has geographic role of latitude
- Make sure the gc_newlon_degrees has geographic role of longitude
- Drag gc_newlat_degrees to rows
- Drag gc_newlon_degress to columns
- Drag Path to Detail
- Drag BezierValue (bin) to detail
- Change mark type to line
- Drag Bezier (bin) to path (make sure show missing values is enabled)
- Size as small as possible, Transparency to something like 10%

And viola! There are now great arcs in YOUR Tableau workbook. I chose not to get into the math in this post, however, it is all in the workbook below and based on the python code I referenced in the beginning of the post. Feel free to dissect the math as much as your little heart desires.
Note: If you get an error on your fields when copying and pasting the calculated fields into your workbook it is likely due to your latitude and longitude having different names. You have two options here: (1) undo the paste, change your field names and paste again, or (2) update the ptlat_radian and ptlon_radian (and a few other) fields to point to your latitude and longitude fields respectively.
Wargames! (gifs courtesy of Allan Walker)


When I showed this to Allan Walker and Anya, we had a quick conversation around the correct use case to support the need for great arcs in Tableau. It did not take long for the group to land on the 1983 movie Wargames (of course!). So, without further ado, we give you Wargames in Tableau...
Enjoy!
