Hiding Selection Borders in Tableau
/A few days ago Anya A'Hearn sent me an image and a request:
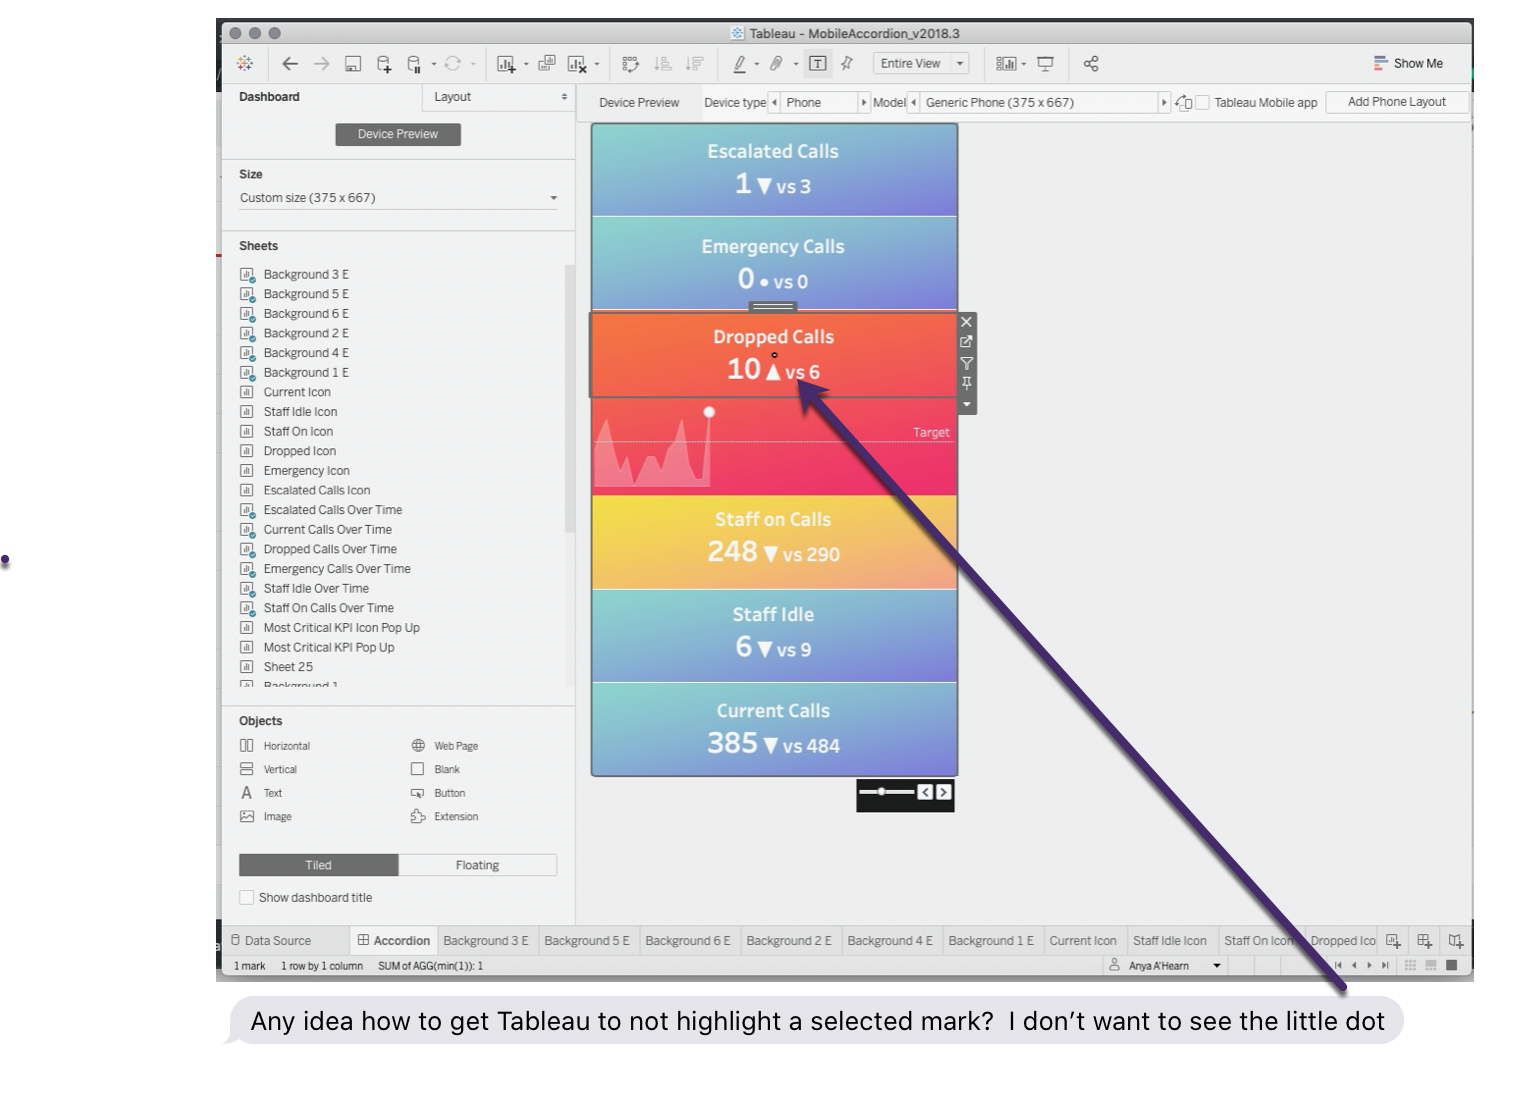
In the dashboard the user can tap on one of the rectangles (like the Dropped calls sheet) and then it’ll “expand” to show the area chart for that particular measure. Anya wanted to remove the selected mark on the Dropped Calls sheet (the little black mark above the triangle). You can see her completed viz in her post: Mobile Accordion: easy access to details
So how did we get rid of that black stain on those lovely gradient backgrounds? With a parameter action, calculated field, and data blending, of course! Read on to find out!
Mark selection in Tableau
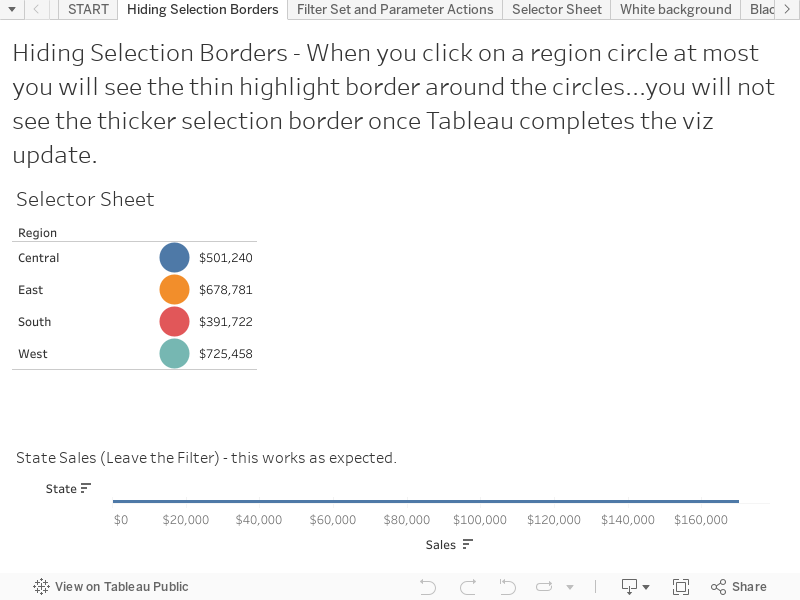
There are several states for non-text mark selection and highlighting in Tableau, this view demonstrates them:

Selected marks show the full color of the mark and get a thick border (black if the view has a light background, white if the worksheet has a dark background).
Hovered-over marks will get a thin border (again black or white depending on the worksheet background); note that hovering doesn't really exist as an interaction method for mobile applications, and also the hover borders don't appear on Tableau Server/Online/Public if the viz has server-side rendering in place.
Non-selected nor hovered-over marks won't get any additional border beyond that set by the Color shelf.
In addition highlighted marks from selecting mark(s), selecting a header, using a Highlighter or using a Highlight Action (such as the Furniture marks in the above view) show their full color while non-highlighted marks are de-saturated.
Text marks are a little different, in that case the selection and highlighting depends on whether the marks are drawn from:
A continuous axis (i.e. green/continuous fields on Rows and/or Columns), in which case they end up a blue background for the selected mark(s) and a bottom border for hover.
Discrete headers (i.e. just blue/discrete fields on Rows and/or Columns), in which case cells are selected and each cell has a blue background and the border of the cell is used for hover.
In both cases the hover (and temporary selection) color is either black or white based on the background if there's nothing on the Color shelf, otherwise it's based on mark's color.
In the original screenshot that Anya made the worksheets were using a circle mark with the text & arrows coming from mark labels, and the black dot is coming from that circle mark when it's selected. In the published viz Anya had switched to using text marks because the hover behavior with the horizontal lines looks a little more natural.
A progression of ideas
Putting together a solution for this didn't come out of nowhere, nor did it spring fully formed from my brain. Awhile back Joshua Milligan wrote Never Ending Navigation Buttons that Deselect Themselves, which is a huge inspiration for this post. Then a couple of years ago I did a number of experiments (some with Rody Zakovich) on selection and highlighting using replicated or self-unioned data sources and calculations, including Using a Filter Action as a Parameter, Multiple Ways to Multi-Select and Highlight in Tableau, Creating a Dynamic Range Parameter in Tableau, and Parameter Actions: Using a Parameter as a Data Source.
A key insight from all that prior research and experimenting is that if we want Tableau to de-select a mark (and get rid of that selection border) we have to a) select something else or... b) get rid of the mark (and potentially replace it with something else!). Joshua's post is a really straightforward example of the latter.
Now a mark in Tableau is created for each unique combination of values of the dimension(s) (and Measure Names) on Rows, Columns, Pages, and the Marks card. Therefore I knew that if I used a self-union then with two copies of the data I could have a dimension for the copy to create a different mark and get the desired effect, but that requires extra data preparation that sometimes isn't feasible due to data source size, lack of data preparation options, etc. I did a few more experiments with parameter actions and set actions and filter actions, and nothing worked reliably across single worksheets, dashboards, and Tableau Server/Public, so I turned to some even earlier experimentation on order of operations and data blending, like this Think Data Thursday on Data Blending (YouTube video)
Here's an annotated picture of Tableau's order of operations from the manual:

I'll start from the bottom of the highlighted purple areas and work my way up the order of operations to talk about how this comes together:
- Tableau uses the dimension values in the view (on Rows, Columns, Pages, and the Marks Card) to create marks.
- When using data blending dimensions from the secondary source(s) contribute to the viz level of detail for creating marks just like dimensions from primary sources. Therefore when we change the values of those secondary dimensions we can get new marks. Filtering the data is one way this happens all the time.
- Because data blending happens after record-level values are assigned we can use calculated record-level values as linking dimensions. Therefore we can change the values of the secondary dimensions dynamically.
- And with parameter actions we can choose what those new values are!
Here's a GIF of this put into in action...when I click on a mark it changes the value of the Hide Selection Border Parameter, which then changes the calculated dimension (not seen in the viz), which changes the secondary Hide Selection Border dimension result from the data blend and draws the new mark.

I set this up as a demo, in the mobile viz above the marks are just drawn in the same location so it looks like nothing changed.
(If this seems like an overly complicated just to remove a black or white border from selected marks, yes, I agree with you, which is also why I sent an early draft of this post & visualization to the Tableau developers working on interactivity. And we do the best we can with the tools that we have!)
How to build a view that hides the selection borders
1. Create the worksheet that you want to hide the selection borders for.

2. Create a Hide Selection Border Parameter with an integer value of 1.
3. Create a Hide Selection Border calculated dimension with the formula
CASE [Hide Selection Border Parameter]
    WHEN 1 THEN 2
    WHEN 2 THEN 1
END
Note that Tableau's default behavior is to make the new field a measure, you'll need to turn it into a dimension.
4. Connect to a new data source that has two rows with values 1 and 2.

5. Rename the field for the two values to Hide Selection Border and make it a dimension.
6. From the two row source add the Hide Selection Border dimension to the view you created in step 1 and make sure it's a linking dimension.

7. If desired add the worksheet to a dashboard with other sheets.
8. If you have just a worksheet then you'll use Worksheet->Actions... otherwise you'll use Dashboard->Actions... to open the Actions window.
9. Add a Parameter action. Configure the Parameter action to use the worksheet on Select to change the value of the Hide Selection Border Param using the Hide Selection Border dimension from the secondary source, with no aggregation.

10. Add a Highlight action. Configure the Highlight Action on Select to highlight the Hide Selection Border calculated dimension. (This is using a variation of the Default Highlighting technique from Brian Moore , thanks to Jeffrey Shaffer for the suggestion!).

11. Close the Actions window.
12. Click on a mark and watch it have the selected border for an instant, then the viz will refresh (often invisibly) and the selection border will go away, and then if your pointer is still over the mark the highlight border will appear.
Here's a Tableau Public view showing this set up:
How this works in detail
1. The viz starts out with the following settings:
The Hide Selection Border Parameter has a given value, let's say 1
Therefore the Hide Selection Border calculated dimension has a value of 2, and the Hide Selection Border dimension from the secondary two row source then has a value of 2.
2. When we click on a mark four things happen:
Tableau and gives the selected mark the thick selection border for a split second.
The Highlight action is triggered and since all the marks have the same highlight value from the Hide Selection Border dimension they are all highlighted (and therefore we don't see the saturated color for the selected mark and desaturated color for the unselected marks).
The Parameter action is triggered, with a new value (2 in this example) for the Hide Selection Border Parameter.
A viz refresh begins.
3. When the viz refreshes:
Depending on how fast Tableau Desktop/Server/Online/Public are we might see the viz slightly greyed out during the refresh.
The Hide Selection Border Parameter has a new value (2 in this example) so that changes the result of the Hide Selection Border calculated dimension (to 1 in this example).
That then changes the returned value of the Hide Selection Border dimension from the secondary two row source in the viz, which then means that the marks are all new...and therefore not selected!
4. After the viz refresh is complete:
If our pointer is still placed over a mark — such as the one we just clicked on to trigger all of this — and the viz isn't using server-side rendering then after a couple of seconds the thin hover border will appear.
Impacts on Filter & Set, and Parameter Actions
Since this technique is drawing new marks it changes the behavior for Filter & Set actions that are activated on Select on dimensions that aren't the Hide Selection Border dimension. Here's a list:
Filter Actions
Leave the filter works as expected
Show all values has no effect: all values are always shown. I believe this is because since the view does not select any marks Tableau is always reverting to showing all values. The workaround for this is to use a Parameter action and a calculated field.
Exclude all values has no effect: once initially activated, all values are always excluded. I believe this is because no marks are selected so Tableau is reverting to the Exclude all values. The workaround for this would be to use a Parameter action and a calculated field.
Set Actions
Keep set values: works as expected
Add all values has no effect: the behavior is the same as "Keep set values". My reasoning here is that the Set action is tied to a dimension that is not changing, so the Set Action isn't actually being triggered by the viz update.
Remove all values has no effect: the behavior is the same as "Keep set values". Same reasoning as "Add all values".
Parameter actions work as expected, and by using a calculated field based on the current parameter value we can get show all values/exclude all values behavior as desired.
Impact on Viz Animations
Tableau's forthcoming animated viz transitions feature was announced at TC19. I tried out this technique with an animation pre-release and it had some interesting effects! However since the software isn't even beta yet I can't be sure of what will be possible in the final release so that'll be an area for more investigation as time goes on.
Conclusion
I generally believe that Tableau (the company) has made a lot of good decisions around the tradeoffs between time/speed to visualization vs. complexity & control, and there are times that I want more control over interactivity & display, and that's what this technique for hiding selection borders is all about! Here’s a link to the viz on Tableau Public: Hiding Selection Borders
