On the topic of community: & being friends and mentors.
/First - sign up and sign up for Emily Kunde's Mentor Match program, and have a chance to win an hour of help with either Allan or Anya as well as other prizes to be announced on Emily's site soon.
This friendship started with a Tweet: March 5th, 2014 Tweet to @AllanWalkerIT "help…..! ? Since you are the king of Tableau Maps, I wanted to see if you had any suggestions?" For over two years now, we have worked together on many collaborations. We hope with a quick review of how we have expanded our skills by working together, you can learn from our take-aways and find friends and mentors to work with.

Anya:
Before having reached out to Allan for mapping help, I knew of his Zen Master-ness and his mad skill at all things map-tastick. Everything was always black and nothing ever looked like Tableau. He had a bizzare headshot of himself from the side in a baseball hat.
Allan:
Before I was contacted by Anya, I did know quite a little about her. I'd giggled like a loon at Twitter TV, thinking "oh, that's not a bar chart". And I'd also seen "Fireworks". That one: now somebody was doing something, well, different - and making Tableau not look like Tableau. Also, I'd seen "SNAP". So I was pretty happy to help out.
Take-away #1: Reach out!
Anya: Allan pointed me in the direction of needing to building my own map server and the result was a cartoon'ish hand-drawn map inside of Tableau. I got the aesthetic that I wanted, as well as a push to not accept things out of the box.

Take-away #2: Don't accept no. If you want a certain look, pick away at it, tinker. You'll learn a lot on the way. I realized maps are points, lines, and shapes, just like a Tableau viz.
Allan:
I didn't know the geography of San Francisco (at all) - I didn't know what the Muni was. But, I now knew someone who lived there! I also didn't have a clue about (dashboard) design, and now I knew someone who did! I was however able to build shortest routes, isopleths and parameters. So - on the dawn of Tableau 9.0, this was born. It even had a Stamen TMS!

Take-away #3: 1+1=3! Know what your strengths and weaknesses are. Learn from each other.
Anya: This one also involved Noah Salvaterra, and was schemed up at TC14 late night. Allan had his hands on some NY Taxi data. I wanted to show how to leverage geospatial data with customer information and create "Location Intelligence" dashboards. As a result, Allan created server-side animation, performed a nearest neighbor analysis, and added Alerts via JavaScript to support the use case. Noah interpolated time :-)

Take-away #4: Wonder, what if? Then try.
Allan:
We got our hands on some twitter data. I learned if the data is crap, you can still put lipstick on a pig. I added some voice and gesture control (hello Jeff Shaffer): Anya added a fabulous Keith Haring map!

Take-away #5: Sometimes design can trump data - but don't make a habit of it.
Anya: Allan said, "I want Skyfall!!!!! Make it so." So I did. A million shapefiles, design tweaks, and bottles of wine later....

Take-away #6: To quote Joe Mako, "The juice is worth the squeeze."
Allan:
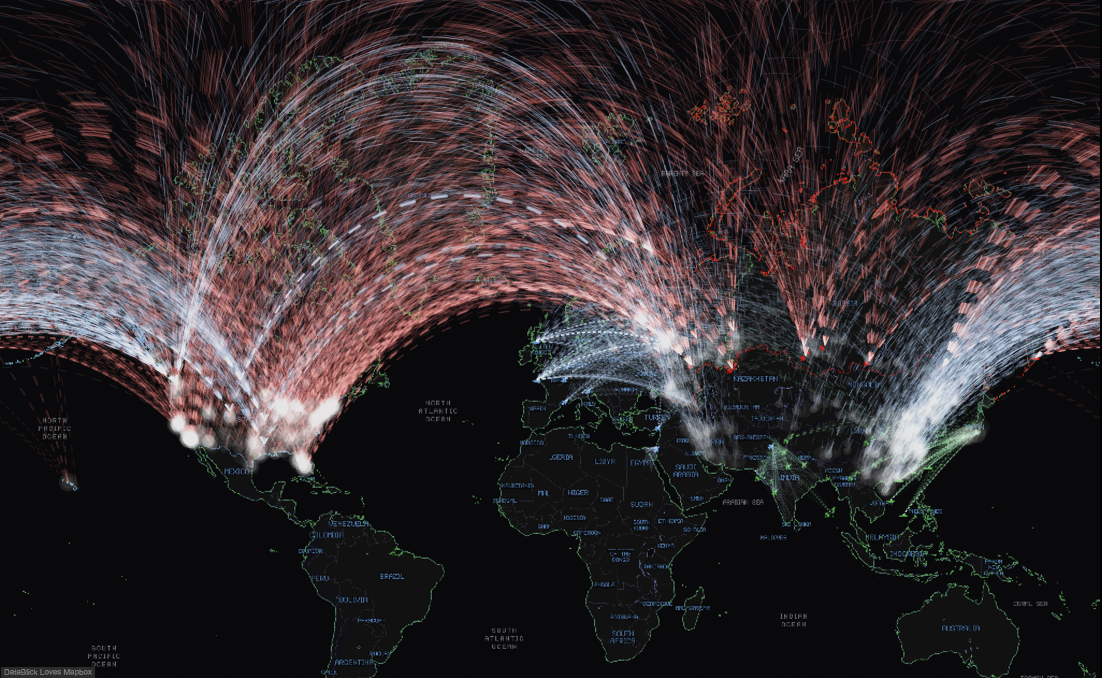
Now it was time to get absolutely ridiculous. We'd done Skyfall: what about WarGames? Oh hello, Chris DeMartini. Great Arcs, data densification...crazy detailed map...serverside animation, responsive dashboards...polar projections...
Take-away #7: Everything is Tablossible!
Anya: To support the Tableau Foundation, a few Tableau volunteers, began to support PATH and the Zambian Ministry of Health to eradicate Malaria in Zambia by 2020. What started as a request for help with a few dashboards, has now turned into an effort spanning the communities of not only Tableau, but Mapbox, Alteryx, Twillio, Exasol, and others.

Take-away # 8: There is an amazing Tableau Community out there. Sign up for Emily's Mentor Match and see what we can build together. Also, integrate all the things! :-)
