X, Y and a bit of Z - Cheater 3D Orthographic Views & Making everything "Spatial"
/Intro from Noah:
Anya must have pinged me 10 times over the course of the last week asking me questions about rendering 3d cars in Tableau. I figured it must have something to do with curing malaria. My reply was a bit ironic given the fact that I’ve done my own 3d car. I did it for fun though… I don’t like being told I can’t do stuff. it just doesn’t work as part of a production workbook. Well… from a performance standpoint maybe we will get there soon. But for now my suggestion was to pick a good angle and then drive a steamroller over it and just make it into polygons. I really should have seen the next question coming, but she asked how to do that. I was stumped. My best idea was, hire a graphic artist to trace it for you…
Last night she told me she solved it using QGIS… mind explosion! Of course! Why not use mapping software for this? Geography isn’t the only thing spatial. Why shouldn’t you use QGIS to map your car, your plane, the shelves of your supermarket, what have you. I always thought background images were misplaced in Tableau, I wonder if this is what they were thinking when they put it under maps. Latitude and Longitude are just a special name for x and y (or is it the other way around?). Why not hijack Tableau’s mapping capabilities and import your polygons as custom shapes?
I’ve gone to great lengths to hack multiple layers onto maps, so I was excited to hear multi-layered maps will be coming to Tableau, but this opens the door to hacking that feature into all sorts of things. Someone once told me that everything in Tableau is a scatterplot but I’m starting to think maybe everything should be a map. Oh… I am going to crash that Beta so hard!
Awesome work Anya! I can’t wait to see what what people will do with this once you release it in the wild.
Anya:
I spent my weekend playing with cars. Not the really fun way, like test driving a fancy one, but in SketchUP, Photoshop, QGIS, Alteryx, and Tableau. I have a Nissan Rogue, which up until recently was a mom-car-kid schlepper, but thanks to the new Star Wars movie, it gets chased by Imperial Stormtroopers, AT-ST, new AT-ACT walkers taking on rebel forces as TIE Fighters and X-Wings battle overhead At least my kids now think my car is the bomb!
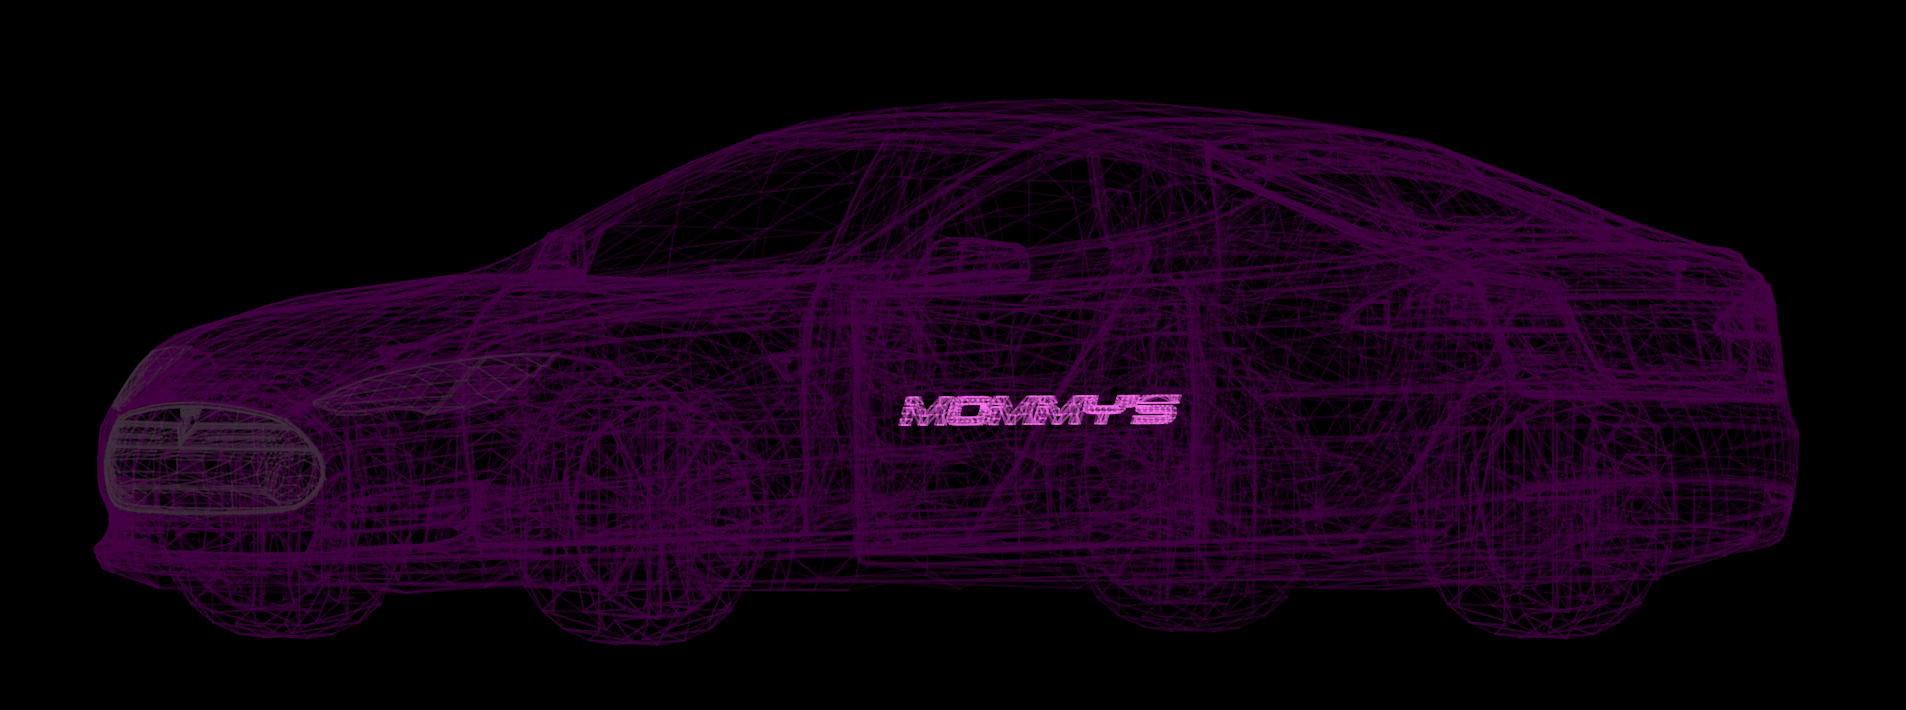
Still not as cool as a Tesla though. Since the 3D Tesla has been on the DataBlick site, we get all manners of projects wanting to have 3D renderings of manufacturing in Tableau along with metrics in a dashboard. As Noah mentioned this is very slow (although I am planning to try it out with new DB-darling, Exasol and rev it up! - ha ha).

In this tutorial, I will walk through using a 3D model to create an orthographic view, and how to turn everything into a map in QGIS, then create shapefiles to bring into Tableau using Alteryx. Everything becomes a map and we can layer whatever we want on it! Union them together, and you can have dots on your shapefile maps easily without having to wait for the future (roadmap) to be here. Play with Transparency, and have at shape / layers / (map) objects.
If you want to find a 3D car model, it has most likely already been created. I will be using Google Sketchup, but there are tons of options out there from Rhino3D to SolidWorks and AutoCAD. Once you download and install SketchUp, there is an online 3D Warehouse to search for items you can use. You can also use SketchUp to make your own models.

Search for items

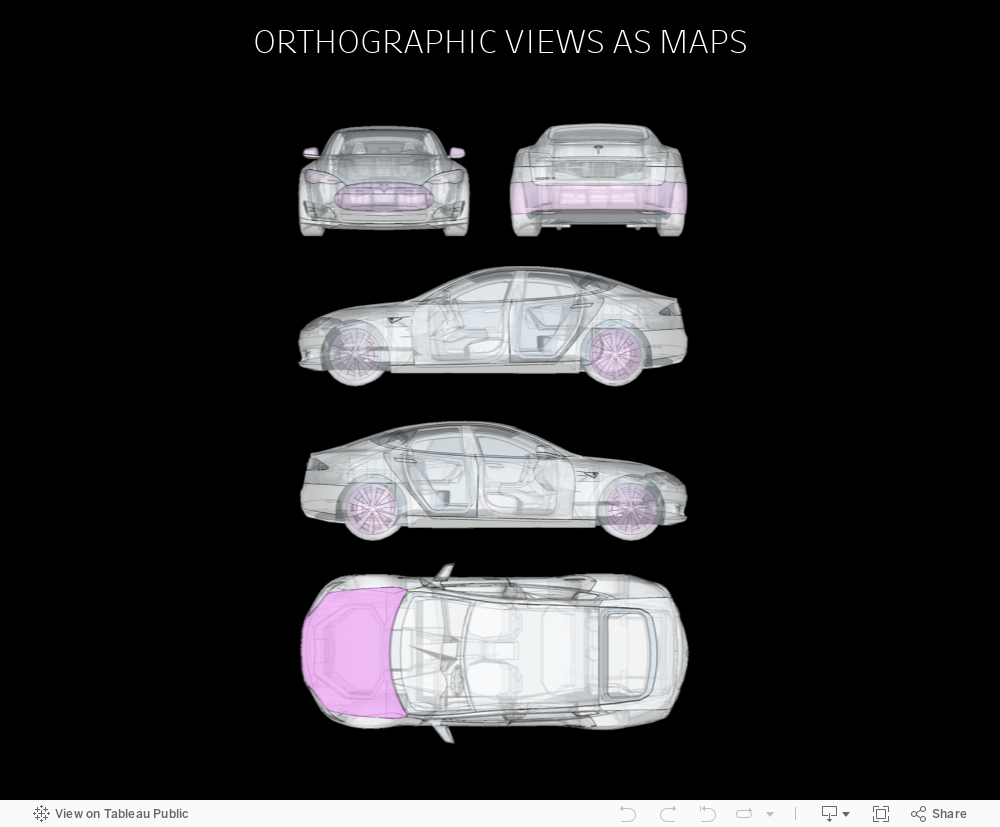
Use the view menu to change the Face and Edge styles to get the look you want. Use the Camera menu to capture views, such as top, left, right, etc. Once you have captured the views that you want to use, lay them out in your favorite graphics program such as GIMP, Photoshop, etc. and save the result as a .png. Write down the image size in pixels somewhere. You will need that in a bit.

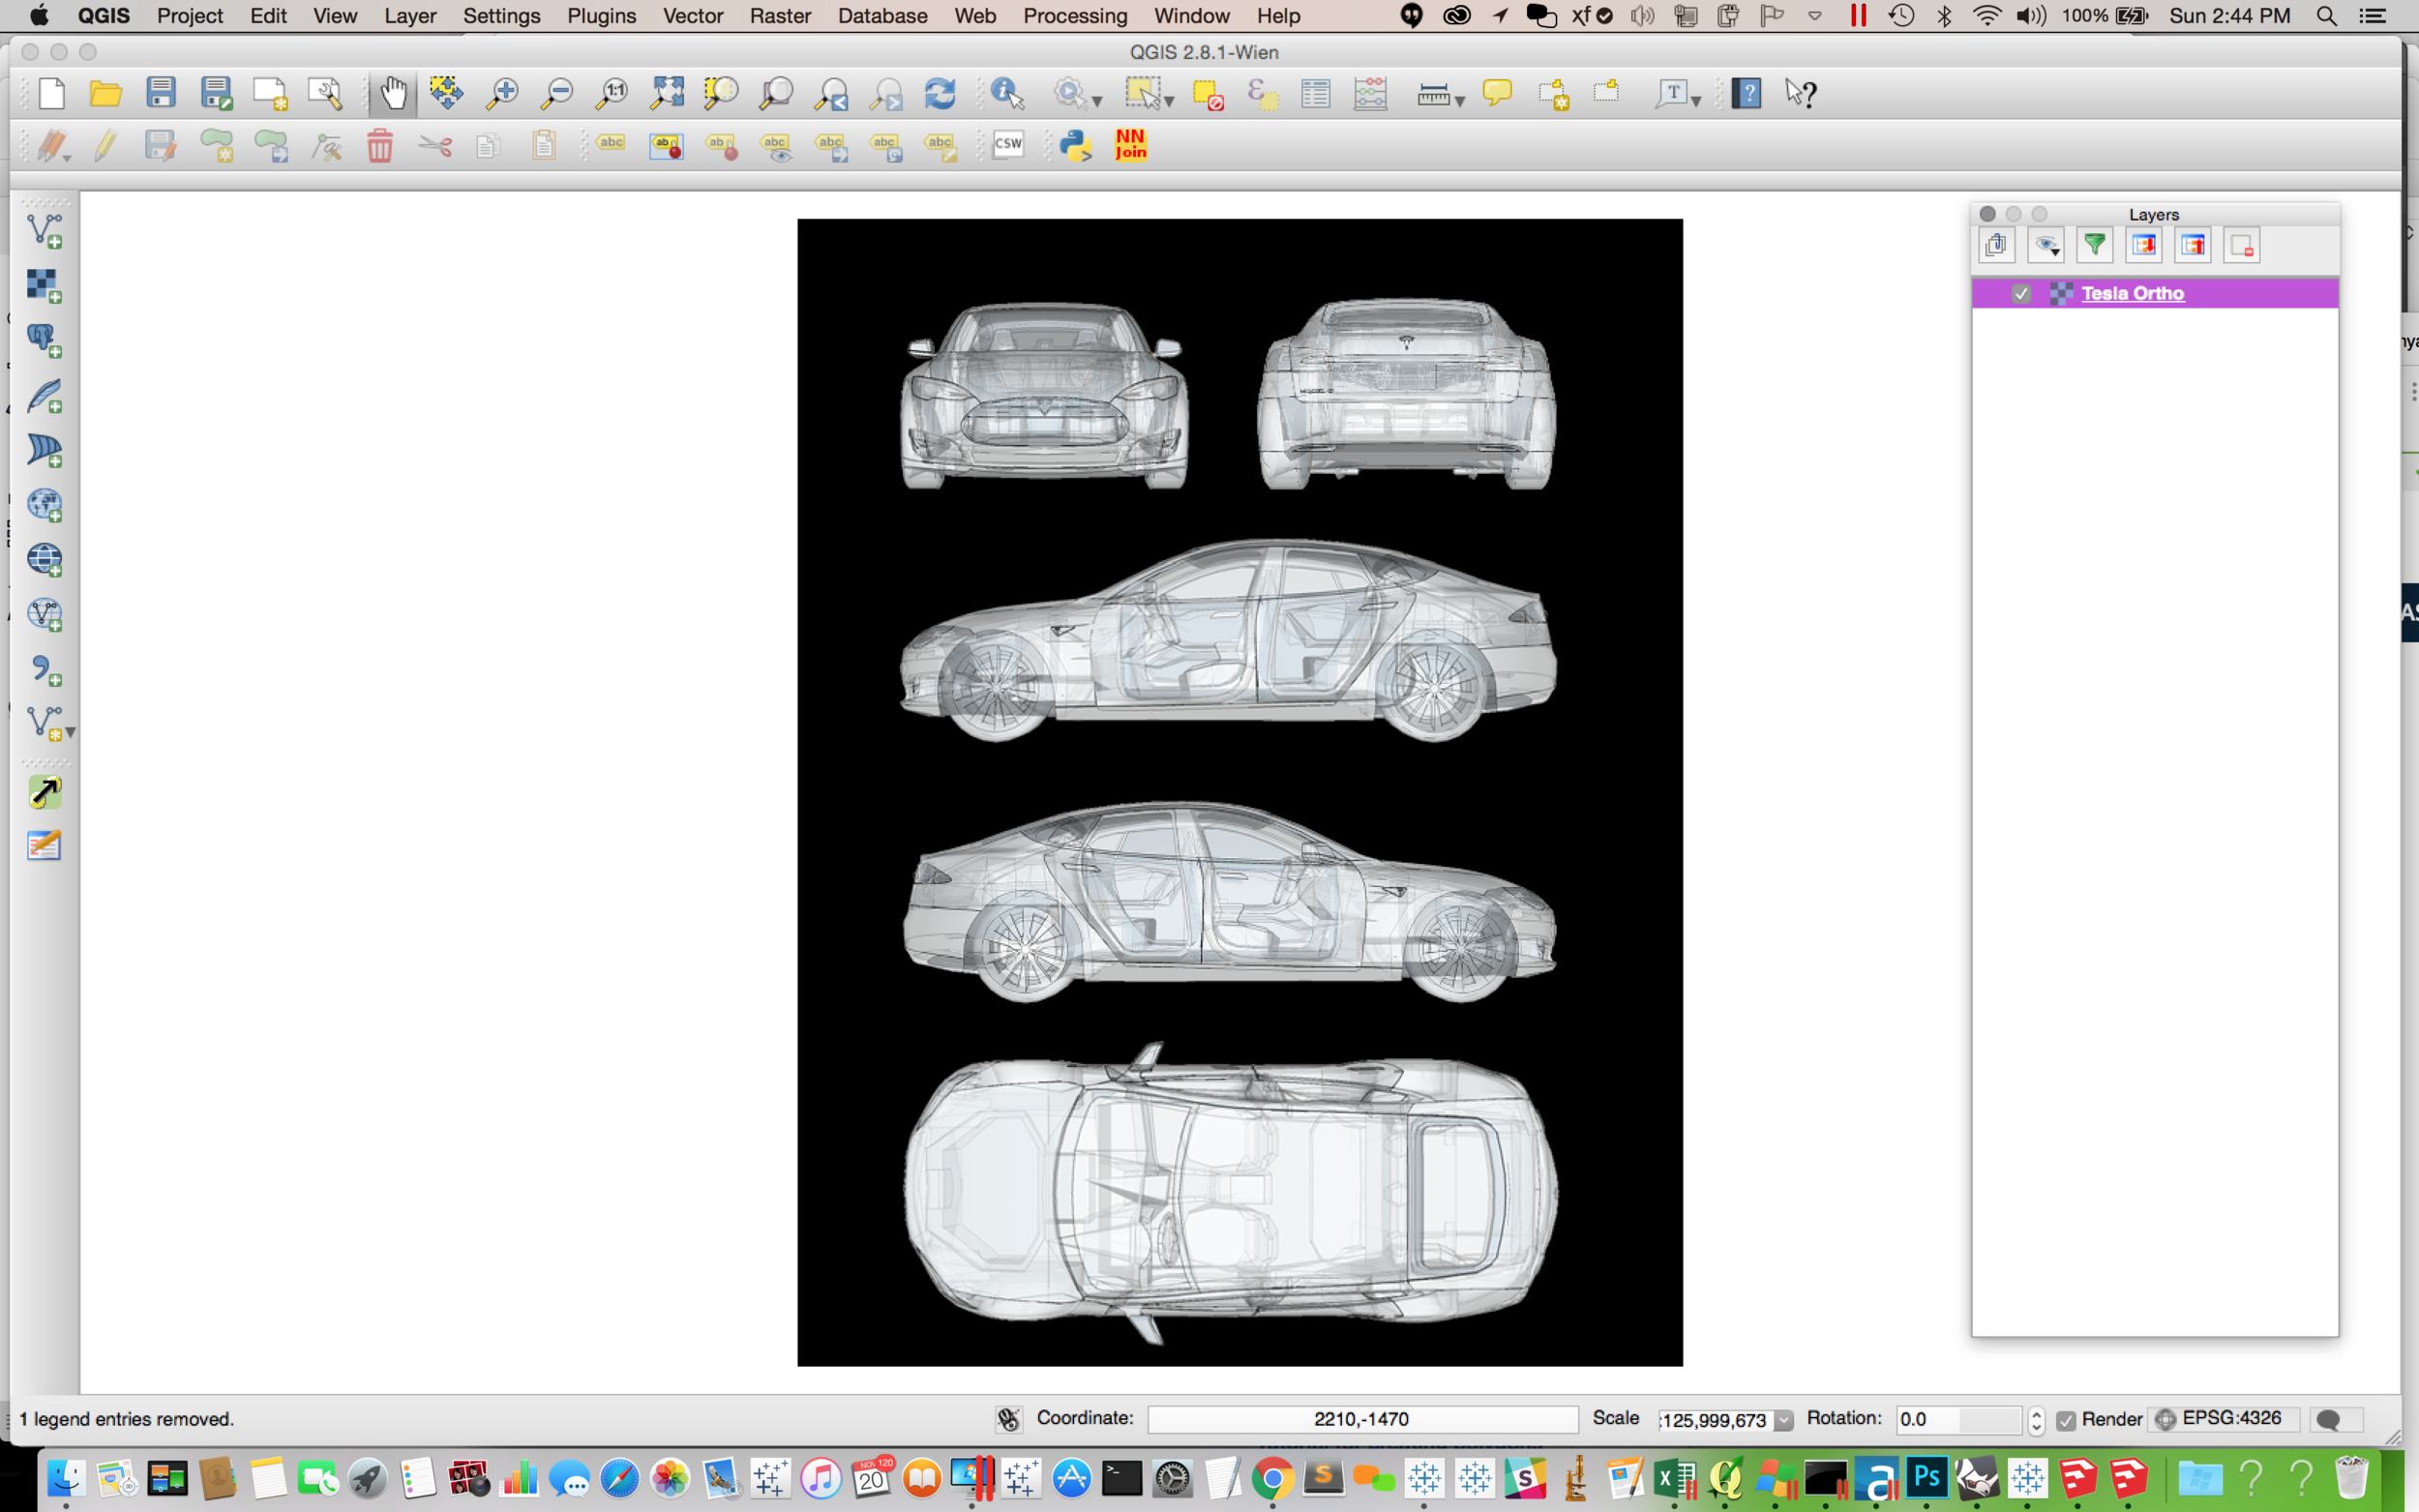
If you haven't already (seriously??? insert "eye-roll" my 11 year old has perfected), please download and install QGIS. It is an open source Geographic Information System. Begin a new project and click on the Add a Raster Layer button. Browse to your .png and click Open.

Your .png is now a geospatial layer. It's a map!
Now it is time to add your own shapes as map objects by drawing them in QGIS. Using the Layer menu, select New Shapefile Layer. (You could also add part shapes by exporting them from you CAD software, importing them as layers too, and convert them from raster to vector.)

Make sure to select Polygon. You can name the layer, something like auto parts of whatever would correspond to a Dimension in your data that you want to display on the car. Delete "id" from the attributes list and add your auto parts to the list, and click ok. You will be asked to give your new shapefile layer a name and a location to save it.

Your new layer has been added, and now you can edit the layer and start to draw shapes on it. Make sure your new layer is selected and then click on the Edit button (looks like a pencil) and then the Add Features Button.

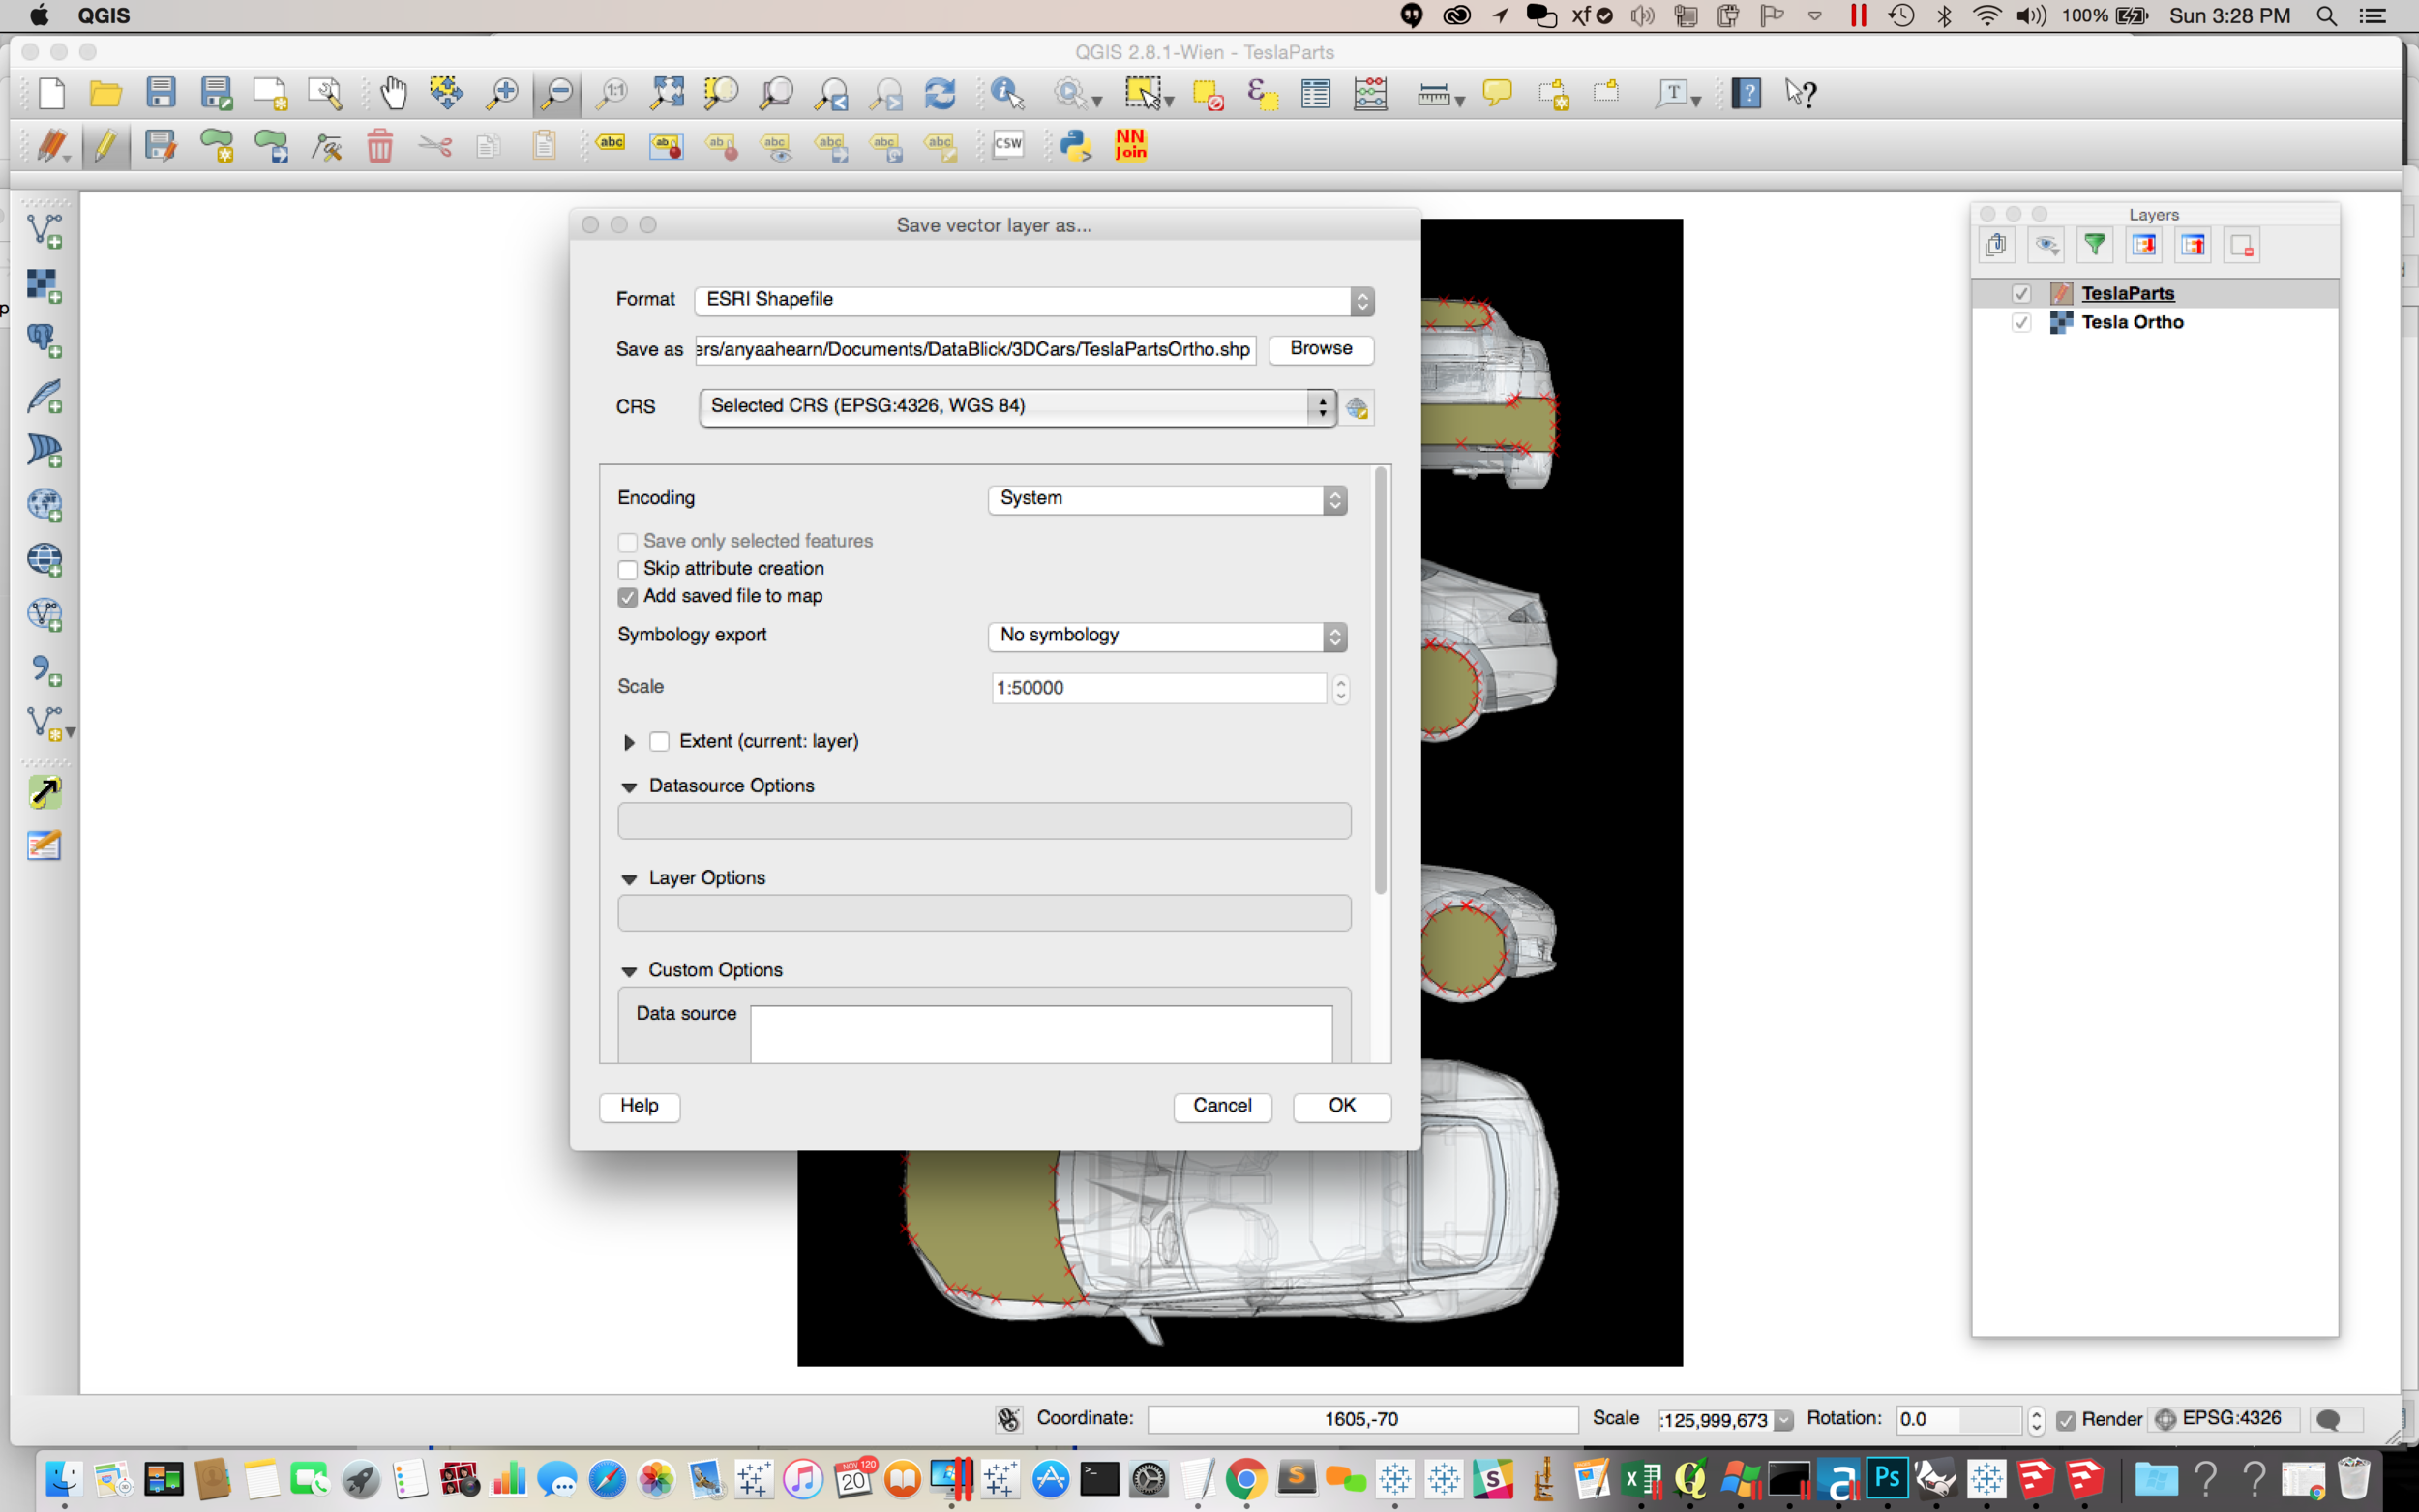
You can now add shapes by drawing them and then giving them the name that matches the items in the Dimension you wish to report on. Once you have traced all your shapes, you should have a view such as the below. Each of those shapes is now a shapefile on a map and has X Y coordinates associated with all the points used to make the shape. Right click on the Layer Name of your shapes, and Save the file as an ESRI Shapefile by browsing for a location to save the file and give it a name.

Now that we have the shapefile, you can use any number of ways to bring it into Tableau. There is Richard Leeke's ShapeToTab, or you can use Alteryx, by using Craig Bloodworth's Shapefile to Polygon Converter. It's free in the gallery. I will use the Alteryx tool which outputs a lovely .tde for me to use in Tableau.
Take your fancy new .tde and create a new Tableau workbook using it. Join the .tde to your data and create a new sheet. Add your Latitude and Longitude to the sheet and from the Map menu, select Background Image and add your .png of your orthographic view. Make sure to add the correct coordinates which should correspond to the image size I asked you to write down earlier.

Now you can create your view in Tableau using the shapefiles that you just imported. Set up your sheet to use the Auto Part, and Polygon ID as your Level of Detail. Change the Mark Type to Polygon, and add the PointID to the Path card. Color by your Metric and ta-da! I can now have a pink Tesla! :-)

There you have it, cheater 3D. Don't worry though. I didn't make you hunt for 3D files for nothing. Next post we are going full 3D exploded, rotatable, part-selectable in Tableau! And since it is a 3D model, we can trick it out any way we want to :-).