Tableau JS API 102
/Padawan Challenge: Build a Website with 4 fully responsive Tableau Dashboard views and add an Open Parameter that affects all of them.
Hello Dojo’ers! Ready to have some more fun with Allan, Chris, and Anya? Get out your favorite text editor, a bag of Skittles (for little rewards here and there) and lets get to it.
Last year at the Tableau conference, DataBlick presented a lot of artsy fartsy bits on how the whole Tableau Dashboard should be a canvas. Data, pixels, design elements, formatting and math should be used to paint the composition of the viz as a whole on the Tableau canvas. In this lesson, we are zooming one step out, and now a Tableau viz becomes a bit of paint on an html canvas.
We will create the .html file below that we can then use as a template for many future lessons.
Type the below in your text editor and save it as PadawanDojo102.html

Aww, you know we never make you type all that, but if you did you get 5 Skittles. Here is the code below:
<!doctype html>
<html>
<head>
<meta charset=“utf-8”>
<meta name=“viewport” content=“width=device-width, initial-scale=1”>
<meta http-equiv=“X-UA-Compatible” content=“IE=edge” />
<meta http-equiv=“Content-Type” content=“text/html; charset=utf-8” />
<meta name=“description” content=“A Template for Tableau JS API” />
<title>Anya’s JS API tutorial</title>
<script src=“https://public.tableau.com/javascripts/api/tableau-2.0.0.min.js” type=“text/javascript”></script>
<script src=“http://code.jquery.com/jquery-1.10.2.js”></script>
<script src=“http://code.jquery.com/ui/1.11.2/jquery-ui.js”></script>
<script src=“https://cdnjs.cloudflare.com/ajax/libs/jqueryui-touch-punch/0.2.3/jquery.ui.touch-punch.min.js”></script>
<style>
</style>
<body>
<center><div id=“tableauViz1”></div></center>
</body>
<script>
var viz, one, two, three, four, workbook, activeSheet, Worksheet, worksheet;
$(function() {
//setting up the Divs
var onePh = document.getElementById(“tableauViz1”);
//setting up the URLs
var oneUrl = “servername/workbookname/dashboardname?:showVizHome=no”;
//setting up the Options
var oneOptions = {
width: “100%”,
height: “100%”,
hideTabs: true,
hideToolbar: true,
onFirstInteractive: function () {
}
};
//initializing the viz
viz1 = new tableauSoftware.Viz(onePh, oneUrl, oneOptions);
});
;
</script>
</html>
Now lets go through it bit by bit:

Now we need a Viz to use as our tabelauViz1, and we need the correct URL where it is located.
In this case we will use a viz on Tableau Public. You can use your own viz, however later in the lesson we will add an open parameter and multiple viz’s that are all affected by the parameter, so they should all have at least one dimension in common. Another 5 Skittles if you make up 4 of your own viz’s. Also, please make sure that the Dashboard size is set to Automatic on all of them before you publish.
Of course you can always use ours. They are not particularly exciting but work well for this lesson:
For now just pick one of them. We will add the rest in a bit.
Change the URL to point to your viz

Using the link from selecting “Share” in either Tableau Server or Public, only copy the portion of text in bold
https://public.tableau.com/views/ThoseSFGiantsFreaksthatShopatSuperStore_0/ThoseSFGiantsFreaksthatShopatSuperStore?:embed=y&:display_count=yes&:showTabs=y
And then paste that part into the var oneURL = up to the “?”. Your link should now look like:
var oneUrl = “https://public.tableau.com/views/ThoseSFGiantsFreaksthatShopatSuperStore_0/ThoseSFGiantsFreaksthatShopatSuperStore?:showVizHome=no”
Save your PadawanDojo102.html file. Open your favorite web browser, and from the File menu, open your new webpage.

You should see your viz, or at least part of it in the web browser. Whey is it all smushed up? Well we haven’t formatted our <div> yet.
Time for a little CSS style for your page! I mean, like really, how embarrassing that your viz had no style.

Up towards the top of your .html file, add the above little bit of css between your <style> tags:
body
#tableauViz1 {
width:100%;
height:100vh;
}
This is telling the browser to fit the with to 100% of the screen and make the height a variable height but always to 100% of the screen height. More on this later…
Save your PadawanDojo102.html file and go back to the web browser view and refresh it. You should now see the below:

Now have a little more fun. Resize your browser window. Go ahead. Do it a few times. Notice how the dashboard resizes to fit whatever size your browser window size is. Pretty sweet. Skittle time, like at least 10 of them!
Well now lets add a few more viz’s to our html canvas.


Your script section should now look like this:
<script>
var viz, one, two, three, four, workbook, activeSheet, Worksheet, worksheet;
$(function() {
//setting up the Divs
var onePh = document.getElementById(“tableauViz1”);
var twoPh = document.getElementById(“tableauViz2”);
var threePh = document.getElementById(“tableauViz3”);
var fourPh = document.getElementById(“tableauViz4”);
//setting up the URLs
var oneUrl = “https://public.tableau.com/views/ThoseSFGiantsFreaksthatShopatSuperStore_0/ThoseSFGiantsFreaksthatShopatSuperStore?:showVizHome=no”;
var twoUrl = “https://public.tableau.com/views/BarChartSFGiantsSuperStore/ThoseSFGiantsFreaksBarChart?:showVizHome=no”;
var threeUrl = “https://public.tableau.com/views/SuperStoreSFGiantsLine/SuperStoreSFGiantsLine?:showVizHome=no”;
var fourUrl = “https://public.tableau.com/views/ThoseSFGiantsFreaksthatShopatSuperStore/ThoseSFGiantsFreaksthatShopatSuperStore?:showVizHome=no”;
var oneOptions = {
width: “100%”,
height: “100%”,
hideTabs: true,
hideToolbar: true,
onFirstInteractive: function () {
}
};
var twoOptions = {
width: “100%”,
height: “100%”,
hideTabs: true,
hideToolbar: true,
onFirstInteractive: function () {
}
};
var threeOptions = {
width: “100%”,
height: “100%”,
hideTabs: true,
hideToolbar: true,
onFirstInteractive: function () {
}
};
var fourOptions = {
width: “100%”,
height: “100%”,
hideTabs: true,
hideToolbar: true,
onFirstInteractive: function () {
}
};
//initializing the viz
viz1 = new tableauSoftware.Viz(onePh, oneUrl, oneOptions);
viz2 = new tableauSoftware.Viz(twoPh, twoUrl, twoOptions);
viz3 = new tableauSoftware.Viz(threePh, threeUrl, threeOptions);
viz4 = new tableauSoftware.Viz(fourPh, fourUrl, fourOptions);
});
;
</script>
You will also need to add that css style to all four viz’s.

#tableauViz1 {
width:100%;
height:100vh;
}
#tableauViz2 {
width:100%;
height:100vh;
float:left;
}
#tableauViz3 {
width:100%;
height:100vh;
float:left;
}
#tableauViz4 {
width:100%;
height:100vh;
float:left;
Save your PadawanDojo102.html file and refresh it in your browser window. Hey that doesn’t look right? WTF? Well we need to put our divs in some containers and then tell the browser how to lay those containers out in the window.
Previously, you had created a div for each of your viz’s. Now we are going to put them in a container, by adding the code (not in bold) around your old div text.
<div id=‘containerA’>
<h2>map one</h2>
<div id=“tableauViz1”></div>
</div>
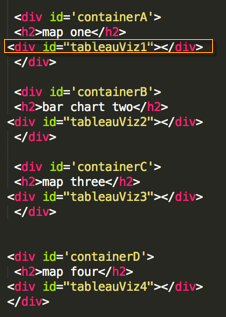
Notice we also added a header over each viz using the <h2> tags. We will get to adding a style for these titles in a second. Change your h2′s to match the title of the viz’s you are using.
First, though we should style each of our containers with css, just like we did with the #tableauViz’s.
In the style section, underneath where you added css for the #tableauViz’s, add the following:
#containerA {
width:50%;
height:100%;
float:left;
}
#containerB {
width:50%;
height:100%;
float:left;
}
#containerC {
width:50%;
height:100%;
float:left;
}
#containerD {
width:50%;
height:100%;
float:left;
}
This is telling the browser that each container is 50% of the with as we are going to tile the four to be two columns and two rows of viz’s. Each of the #tableauViz divs will fill each of their respective contaners 100% width wise and 100vh height wise.
Now lets format those headers.
We will add a format for a main title for our webpage and for the viz titles. Mine are going to be SF Giants orange, aligned center and using the font Arial. You can use a particular font size, but we want it to scale depending on the browser size, so we just used the relative terms of large and medium. Add this text right after your container styling.
h1 {
color: #F2552C;
text-align: center;
font-size:large;
font-family: Arial
}
h2 {
color: #F2552C;
text-align: center;
font-size:medium;
font-family: Arial
}
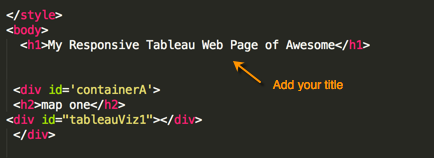
We already added our h2′s to our containers, but let’s add a nice title to appear at the top of the web page above our 4 dashboards. We can add our <h1> right above our first container.
<h1>My Responsive Tableau Web Page of Awesome</h1>
Here is the whole PadawanDojo102.html text up until now (just in case):
<!doctype html>
<html>
<head>
<meta charset=“utf-8”>
<meta name=“viewport” content=“width=device-width, initial-scale=1”>
<meta http-equiv=“X-UA-Compatible” content=“IE=edge” />
<meta http-equiv=“Content-Type” content=“text/html; charset=utf-8” />
<meta name=“description” content=“A Template for Tableau JS API” />
<title>Padawan JS API 102 tutorial</title>
<script src=“https://public.tableau.com/javascripts/api/tableau-2.0.0.min.js” type=“text/javascript”></script>
<script src=“http://code.jquery.com/jquery-1.10.2.js”></script>
<script src=“http://code.jquery.com/ui/1.11.2/jquery-ui.js”></script>
<script src=“https://cdnjs.cloudflare.com/ajax/libs/jqueryui-touch-punch/0.2.3/jquery.ui.touch-punch.min.js”></script>
<style>
body {
background-color: #fff;
}
#tableauViz1 {
width:100%;
height:100vh;
float:left;
}
#tableauViz2 {
width:100%;
height:100vh;
float:left;
}
#tableauViz3 {
width:100%;
height:100vh;
float:left;
}
#tableauViz4 {
width:100%;
height:100vh;
float:left;
}
#containerA {
width:50%;
height:100%;
float:left;
}
#containerB {
width:50%;
height:100%;
float:left;
}
#containerC {
width:50%;
height:100%;
float:left;
}
#containerD {
width:50%;
height:100%;
float:left;
}
h1 {
color: #F2552C;
text-align: center;
font-size:large;
font-family: Arial
}
h2 {
color: #F2552C;
text-align: center;
font-size:medium;
font-family: Arial
}
</style>
<body>
<h1>My Responsive Tableau Web Page of Awesome</h1>
<div id='containerA’>
<h2>map one</h2>
<div id=“tableauViz1”></div>
</div>
<div id='containerB’>
<h2>bar chart two</h2>
<div id=“tableauViz2”></div>
</div>
<div id='containerC’>
<h2>line three</h2>
<div id=“tableauViz3”></div>
</div>
<div id='containerD’>
<h2>circle four</h2>
<div id=“tableauViz4”></div>
</div>
</body>
<script>
var viz, one, two, three, four, workbook, activeSheet, Worksheet, worksheet;
$(function() {
//setting up the Divs
var onePh = document.getElementById(“tableauViz1”);
var twoPh = document.getElementById(“tableauViz2”);
var threePh = document.getElementById(“tableauViz3”);
var fourPh = document.getElementById(“tableauViz4”);
//setting up the URLs
var oneUrl = “https://public.tableau.com/views/ThoseSFGiantsFreaksthatShopatSuperStore_0/ThoseSFGiantsFreaksthatShopatSuperStore?:showVizHome=no”;
var twoUrl = “https://public.tableau.com/views/BarChartSFGiantsSuperStore/ThoseSFGiantsFreaksBarChart?:showVizHome=no”;
var threeUrl = “https://public.tableau.com/views/SuperStoreSFGiantsLine/SuperStoreSFGiantsLine?:showVizHome=no”;
var fourUrl = “https://public.tableau.com/views/SFGiantsCircles/ProfitbyOrder?:showVizHome=no”;
var oneOptions = {
width: “100%”,
height: “100%”,
hideTabs: true,
hideToolbar: true,
onFirstInteractive: function () {
}
};
var twoOptions = {
width: “100%”,
height: “100%”,
hideTabs: true,
hideToolbar: true,
onFirstInteractive: function () {
}
};
var threeOptions = {
width: “100%”,
height: “100%”,
hideTabs: true,
hideToolbar: true,
onFirstInteractive: function () {
}
};
var fourOptions = {
width: “100%”,
height: “100%”,
hideTabs: true,
hideToolbar: true,
onFirstInteractive: function () {
}
};
//initializing the viz
viz1 = new tableauSoftware.Viz(onePh, oneUrl, oneOptions);
viz2 = new tableauSoftware.Viz(twoPh, twoUrl, twoOptions);
viz3 = new tableauSoftware.Viz(threePh, threeUrl, threeOptions);
viz4 = new tableauSoftware.Viz(fourPh, fourUrl, fourOptions);
});
;
</script>
</html>
Save it and enjoy some more Skittles while you refresh your browser window and see your page with four responsive viz’s. Go wild resizing the browser and see how they all scale to fit!
Time to add some JS API fun and add a parameter that affects all the dashboards.
It is going to be an “open” parameter so that you can type anything in. This is just a teaser to creating dynamic parameters based on whatever data is in the database (which is one thing the Tableau Community has wanted for a very long time). You will have to wait for another dojo post on that though. Got to keep you coming back for more!
We need to add an open parameter to each of our Tableau workbooks.
If you are using our four dashboards this has already been done. They are based on the Department dimension. If you are using your own workbooks, please do the following steps and substitute your dimension of choice. In Tableau right click in the Parameters area and create the below. You will need to create this for each of your workbooks.

Then in each of your viz’s, drag the Department dimension into the filters shelf and create a filter based on the condition below:
IFNULL([Department],'Null’) = IF [DepartmentParameter] != 'ALL’ THEN [DepartmentParameter] ELSE IFNULL([Department], 'Null’) END

If you are using your own workbooks, please save and republish them.
Now to add the JS to our PadawanDojo102.html file.
You can find all kinds of fun widgets to use here http://jqueryui.com/demos/
First we will add a div for our fancy parameter right after our <h1> header

<div class=“ui-widget”>
<input id=“DEPARTMENTPARAMETER”>
</div>
Now to add the script functionality.
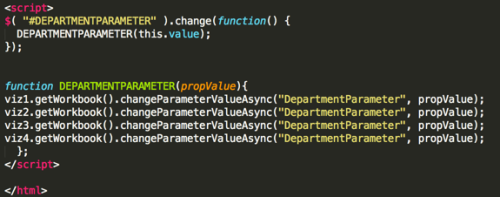
Add the below after the <script/> tag for your viz’s.

<script>
$( “#DEPARTMENTPARAMETER” ).change(function() {
DEPARTMENTPARAMETER(this.value);
});
function DEPARTMENTPARAMETER(propValue){
viz1.getWorkbook().changeParameterValueAsync(“DepartmentParameter”, propValue);
viz2.getWorkbook().changeParameterValueAsync(“DepartmentParameter”, propValue);
viz3.getWorkbook().changeParameterValueAsync(“DepartmentParameter”, propValue);
viz4.getWorkbook().changeParameterValueAsync(“DepartmentParameter”, propValue);
};
</script>
Save your PadawanDojo102.html file and refresh the browser. You should now see an input box, for the user to type values for the parameter filter.

Go ahead and type “Furniture”. Please make sure it is typed exactly the same. You should now see all of your dashboards filtered on Furniture. How fun was that! Now type in “Technology”. All the filters update again.
The final code if you need it is on our GIT.
You now have a webpage with 4 viz’s that are responsive in size and an open parameter that affects all of them. Finish off that bag of Skittles!!! You just learned about jQuery UI widgets, CSS, HTML, JS and the Tableau JS API.
